Rasch analysis has been used in recent studies to test the psychometric properties of a questionnaire. The conditions for use of the Rasch model are one-dimensionality (assessed via prior factor analysis) and local independence (the probability of getting a particular item right or wrong should not be conditioned upon success or failure in another).
ObjectiveTo evaluate the dimensionality and the psychometric properties of the Fonseca anamnestic index (FAI), such as the fit of the data to the model, the degree of difficulty of the items, and the ability to respond in patients with myogenous temporomandibular disorder (TMD).
MethodsThe sample consisted of 94 women with myogenous TMD, diagnosed by the Research Diagnostic Criteria for Temporomandibular Disorders (RDC/TMD), who answered the FAI. For the factor analysis, we applied the Kaiser–Meyer–Olkin test, Bartlett's sphericity, Spearman's correlation, and the determinant of the correlation matrix. For extraction of the factors/dimensions, an eigenvalue >1.0 was used, followed by oblique oblimin rotation. The Rasch analysis was conducted on the dimension that showed the highest proportion of variance explained.
ResultsAdequate sample “n” and FAI multidimensionality were observed. Dimension 1 (primary) consisted of items 1, 2, 3, 6, and 7. All items of dimension 1 showed adequate fit to the model, being observed according to the degree of difficulty (from most difficult to easiest), respectively, items 2, 1, 3, 6, and 7.
ConclusionThe FAI presented multidimensionality with its main dimension consisting of five reliable items with adequate fit to the composition of its structure.
Temporomandibular disorder (TMD) is defined as a set of clinical alterations involving the masticatory muscles, the temporomandibular joint (TMJ), and associated structures.1 The characteristic signs and symptoms of TMD are: deviations and/or limited mandibular movements,2 tenderness of the masticatory muscles and TMJ,3 joint clicking and crackling during mandibular function,4 tinnitus, headache, pain or discomfort around the ear and neck pain.1
The TMD has a higher prevalence in the female gender5,6 and a multifactorial etiology associated with predisposing, initiating, and perpetuating factors such as trauma to the local tissue, chronic repetitive microtrauma, infrequent use of the jaw, and increased level of emotional stress.7 Given its multifactorial nature, the diagnosis of TMD becomes complex and controversial8 and requires a multidisciplinary team of doctors, dentists, and physical therapists.9 However, given the need for an accurate and early diagnosis for proper treatment of the dysfunction, questionnaires such as the Fonseca anamnestic index (FAI) and the Research Diagnostic Criteria for Temporomandibular Disorders (RDC/TMD) were created.10,11 Electronic equipment, such as electromyography12 and thermography,13 is also used to assist the diagnosis of TMD.
The RDC/TMD is widely accepted as a validated and standardized diagnostic tool for TMD, showing good accuracy and reliability to diagnose myogenous TMD.14 However, the instrument is rarely used in clinical practice because it is difficult to administered due to its length and need for assessor training and experience.15 The applicability of the RDC/TMD in epidemiological studies can be difficult, depending on the interview technique or the time available for the data collection.16 Finally, it is worth noting that the RDC/TMD has been updated to the Diagnostic Criteria for Temporomandibular Disorders (DC/TMD) with the intention of improving the description of its procedures and promoting a more accurate and appropriate diagnosis for the clinical environment and for research.17
In comparison, the FAI is a patient-reported outcome instrument, in which the answers are collected directly from the assessed individual. The FAI is quick and easy to administer and does not require assessor training. The instrument has shown high accuracy, sensitivity, and specificity for the selection of individuals with and without myogenous TMD.18 It also provides characterization of TMD in a simple, quick, and low-cost manner and can even be applied via telephone.19 Moreover, the FAI shows potential for use in epidemiological studies20 or even prior to the RDC/TMD, facilitating the diagnosis. However, it is important to note that the FAI does not replace the clinical evaluation of specific tests such as the DC/TMD, which is considered the gold standard instrument for the diagnosis of myogenous TMD.
Many studies are found in the literature using the FAI in the evaluation of TMD.18–21 However, some studies point out limitations in its items because they have very different relevance in the etiology and symptomatology of the dysfunction,21,22 assessing pain during chewing, sensation of poor dental occlusion, difficulty moving the TMJ, parafunctional habits, emotional stress, and head and neck pain.23,24
In this context, Campos et al.19 conducted a confirmatory analysis of the FAI and found inadequate internal consistency/reliability, suggesting the exclusion of some items to improve the index. However, it is noteworthy that the authors performed the analysis without taking into consideration the possible multidimensionality of the index as suggested by Nomura et al.,25 that is, if it has more than one dimension to evaluate the construct for which it is intended.
To assess the dimensionality of a questionnaire, the COnsensus-based Standards for the selection of health Measurement INstruments (COSMIN) recommends the use of exploratory factor analysis, which should always be performed prior to reliability testing and psychometric assessments to test the structural validity of the instrument.26–28 It should be highlighted that the COSMIN is a detailed guide developed for the validation, cross-cultural adaptation, and critical evaluation of studies that aim to evaluate measurement instruments in the area of health.28
The Rasch model (one of the item response theory models) has been used to conduct fit statistical analysis to evaluate the differences between the responses for items (questions) of a questionnaire and the model. The conditions for use of the Rasch model are one-dimensionality (if the questionnaire has more than one dimension, it is suggested that items belonging to secondary dimensions be deleted and the analysis conducted only on the dimension that best explains the variance of the construct being evaluated) and local independence (in which the probability of getting a particular item right or wrong should not be conditioned upon success or failure in another item).27–29
The technical statistics of item response theory have been recognized as the most robust strategies for the construction and validation of psychometric instruments.30 The Rasch model, in particular, converts ordinal measures into interval measures29,31 and is a mathematical model that deals with the probability of getting an item right, comparing its difficulty, and the ability of the assessed individual.30,32,33
Thus, considering the FAI as a quick and affordable tool for the diagnosis, treatment indication, and monitoring of patients with TMD, the objective of the present study was to evaluate the dimensionality and the psychometric properties of this instrument, including the fit of the data to the model, the degree of difficulty of the items, and the ability to respond in subjects with myogenous TMD.
The study hypothesis is that the FAI will present more than one dimension for the assessment of the primary construct (TMD) and well-fitting items in the dimension that has the greatest explained variance.
MethodStudy designThis is a cross-sectional observational study approved by the Ethics Committee of Universidade Metodista de Piracicaba (UNIMEP), Piracicaba, SP, Brazil (protocol number 15/11). All volunteers received information about the evaluation procedures and signed an informed consent form.
SampleBetween 2006 and 2015, 94 female volunteers were recruited from the university community of the city of Piracicaba, SP, Brazil, through personal invitation, posters, and Internet advertisements. After enrolling and meeting the eligibility criteria, the volunteers were allocated to the myogenous TMD group (n=94).
Inclusion criteriaAfter administration of the RDC/TMD, the women diagnosed with myogenous TMD and classified as Ia (myofascial pain) or Ib (myofascial pain with limited opening of the mouth) were selected for the study. Associated diagnoses, such as disk displacement (IIa, IIb, and IIc) and arthralgia (IIIa), were also allowed.
Exclusion criteriaThe following exclusion criteria were applied: age under 18 or over 40; orthodontic treatment, physical therapy, or medication (analgesics, anti-inflammatories, or muscle relaxants); tooth loss; full or partial dentures; history of facial trauma to the face or TMJ; history of subluxation or dislocation of the TMJ; and diagnosis of IIIb (osteoarthritis) or IIIc (osteoarthritis) according to the RDC/TMD.
Assessment toolsResearch Diagnostic Criteria for Temporomandibular Disorders (RDC/TMD)
The RDC is a tool used for the diagnosis of TMD11 and the preferred instrument in cases of myogenous dysfunctions.34 This tool allows the classification of individuals into three groups: I – muscle dysfunction, II – disk displacement, and III – other joint conditions.
Fonseca Anamnestic Index (FAI)The FAI was developed in Brazilian Portuguese to assess the severity of TMD based on the patient's signs and symptoms. This index was created with 10 items with three answer options: “yes”, “sometimes”, or “no”.10 It consists of the following items: I1 – Do you have difficulty opening your mouth wide?; I2 – Do you have difficulty moving your jaw from side to side?; I3 – Do you feel fatigue or muscle pain when chewing?; I4 – Do you have frequent headaches?; I5 – Do you have neck pain or wryneck?; I6 – Do you have earaches or pain in your TMJs?; I7 – Have you noticed any clicking in your TMJs while chewing or opening your mouth?; I8 – Have you noticed if you have a habit of clenching or grinding your teeth?; I9 – Do you feel that your teeth do not articulate well?; I10 – Do you consider yourself a tense (nervous) person?
ProceduresThe volunteers were asked to answer the 10 items/questions with “yes,” “sometimes,” or “no”. Only one answer should be marked for each item. To avoid inducing answers, there was no time limit for completing the questionnaire. Data were filed for prior exploratory factor analysis (to observe the dimensionality of the index) followed by Rasch consistency analysis of the primary dimension of the FAI.
Statistical analysisFor exploratory factor analysis, some tests were conducted beforehand to test their feasibility, including:
- (a)
Kaiser–Meyer–Olkin (KMO) test: this test evaluates the sampling adequacy (“n”) for use of the exploratory factor analysis test. The KMO statistic varies from 0 to 1, with values higher than 0.60 being considered acceptable.26
- (b)
Bartlett's test of sphericity: this test evaluates the null hypothesis that the original correlation matrix (correlation matrix of items that comprise a questionnaire) is equal to an identical matrix (when items of a questionnaire do not correlate with each other, being completely independent). This condition prevents the application of factor analysis because it seeks items that are sufficiently correlated for the extraction of the factors/dimensions. Therefore, a significance value lower than 0.05 is expected in the Bartlett test for adequate use of exploratory factor analysis and rejection of the null hypothesis.26
- (c)
Spearman's correlation: This test evaluates the overall correlation between items, considering values >0.20 for proper correlation.35
- (d)
The determinant of a correlation matrix measures problems with extreme multicollinearity (i.e., questionnaire items that are highly correlated) and singularity (questionnaire items that are perfectly correlated). These problems also hinder the application of the exploratory factor analysis, suggesting the exclusion of problematic items. Because the determinant of a correlation matrix may vary between 0 and 1, it must be greater than 0.00001 to eliminate the possibility of problems of multicollinearity and singularity.26
After confirmation of all of the assumptions for use of the factor test, the factors (dimensions) of the FAI were extracted respecting the eigenvalues above 1.00 in order to maintain a conservative analysis value, since the questionnaire consists of less than 30 items. Oblique oblimin rotation was performed after factor extraction, given that the dimensions of the FAI questionnaire are considered to be correlated because they evaluate the same final construct (TMD). Factor loadings >0.40 were defined for allocation of each item in its respective dimension.26
The internal consistency of the primary dimension (best score for explained variance) previously obtained in the exploratory factor analysis was tested. For this, an overall Cronbach alpha value between 0.70 and 0.95 indicated adequate dimension, values >0.95 indicated inadequate reliability, and values <0.70 indicated low reliability of the dimension.26
Finally, the Rasch analysis was performed on the items that composed the main dimension of the FAI according to fit statistics. The analysis was interpreted using infit and outfit values presented as MnSq (mean-square), which should vary from 0.60 to 1.4 for polytomic items, and associated value of ZStd=±1.9.36,37 Extremely high MnSq values may indicate erratic scores for the item and MnSq values <0.7 indicate little variability of scores for the item, with a very predictable or deterministic answer pattern.36,37 The item's degree of difficulty was evaluated using θ values and the volunteers’ ability to respond was evaluated using b values, represented by a map of item difficulty and ability to respond and using a logit scale (log-odds). Factor and internal consistency analysis was performed using SPSS 20.0 and Rasch analysis using Bigsteps 2.82.
ResultsThe study included 94 volunteers between the age of 18 and 40 (mean age 25.8±4.37 years). In the evaluation using the RDC/TMD, 73 volunteers were diagnosed as Ia, 21 as Ib, 16 as IIa (10 right TMJ/12 left), 2 as IIc (1 right TMJ/2 left TMJ), and 39 as IIIa (27 right TMJ/35 left TMJ).
Table 1 shows the correlation among the ten items, considering the value over 0.2 as the minimum adequate limit of correlation. Some items showed good correlation, but not all items were correlated, suggesting more than one dimension in the FAI. The determinant of the correlation matrix showed acceptable value (no problems with multicollinearity and singularity).
Description of the correlation of the items of the FAI (r value and p value).
| I1 | I2 | I3 | I4 | I5 | I6 | I7 | I8 | I9 | |
|---|---|---|---|---|---|---|---|---|---|
| I2 | 0.41 (0.00) | ||||||||
| I3 | 0.38 (0.00) | 0.42 (0.00) | |||||||
| I4 | −0.14 (0.08) | 0.02 (0.41) | 0.02 (0.42) | ||||||
| I5 | −0.12 (0.11) | −0.12 (0.12) | 0.04 (0.35) | 0.43 (0.00) | |||||
| I6 | 0.14 (0.08) | 0.16 (0.05) | 0.36 (0.00) | 0.11 (0.13) | 0.24 (0.00) | ||||
| I7 | 0.31 (0.00) | 0.36 (0.00) | 0.30 (0.00) | −0.12 (0.11) | 0.05 (0.29) | 0.34 (0.00) | |||
| I8 | −0.07 (0.24) | −0.09 (0.18) | 0.17 (0.04) | 0.12 (0.12) | 0.12 (0.11) | 0.12 (0.09) | 0.14 (0.07) | ||
| I9 | 0.14 (0.00) | 0.15 (0.06) | 0.15 (0.06) | 0.14 (0.08) | 0.03 (0.37) | 0.12 (0.06) | 0.21 (0.02) | 0.31 (0.00) | |
| I10 | 0.09 (0.18) | 0.04 (0.33) | 0.06 (0.25) | 0.21 (0.02) | 0.39 (0.00) | 0.12 (0.08) | 0.05 (0.30) | 0.13 (0.09) | 0.20 (0.02) |
Determinant of correlation matrix=0.162. Spearman's test was used for correlation.
Based on the statistical tests used to evaluate the possibility of application of exploratory factor analysis, the KMO demonstrated the adequacy of the sample (KMO=0.65) and Bartlett's sphericity test rejected the null hypothesis of identical matrix (×245=161.57, p<0.000).
Table 2 shows the factor loading values for each item, as well as the eigenvalues and the proportion of variance explained for each specific dimension. The factors/dimensions extracted from the FAI after oblique rotation were: Dimension 1 (pain in the TMJ, difficulty moving, and clicking in TMJ) composed of items 1, 2, 3, 6, and 7; Dimension 2 (neck pain, headache, and emotional stress) composed of items 4, 5, and 10; and Dimension 3 (parafunctional habits and sensation of malocclusion of the teeth), composed of items 8 and 9. The three dimensions together explained a total of 55.21% of the variance of the FAI; however, the dimension that showed the highest proportion of variance explained was dimension 1, considered as the primary dimension for the Rasch analysis.
Summary of factor loadings of the items of the FAI in each dimension after exploratory factor analysis.
| ITEMS | Dimension 1 | Dimension 2 | Dimension 3 |
|---|---|---|---|
| I1 Do you have difficulty opening your mouth wide? | 0.73a | −0.14 | −0.09 |
| I2 Do you have difficulty moving your jaw from side to side? | 0.77a | −0.04 | −0.14 |
| I3 Do you feel fatigue or muscle pain when chewing? | 0.70a | 0.07 | 0.10 |
| I4 Do you have frequent headaches? | −0.11 | 0.72a | −0.01 |
| I5 Do you have neck pain or wryneck? | −0.05 | 0.86a | −0.07 |
| I6 Do you have earaches or pain in your TMJs? | 0.48a | 0.37 | 0.03 |
| I7 Have you noticed any clicking in your TMJs while chewing or opening your mouth? | 0.62a | −0.05 | 0.22 |
| I8 Have you noticed if you have a habit of clenching or grinding your teeth? | −0.14 | 0.01 | 0.86a |
| I9 Do your feel your teeth do not articulate well? | 0.13 | −0.01 | 0.72a |
| I10 Do you consider yourself a tense (nervous) person? | 0.08 | 0.60a | 0.09 |
| Eigenvalue | 2.48 | 1.90 | 1.13 |
| % of variance explained | 24.82 | 19.01 | 11.38 |
Table 3 shows the new factor analysis of the primary dimension of the FAI conducted to demonstrate the instrument's structural validity. Good sample adequacy was obtained (KMO=0.71), Bartlett's sphericity test rejected the null hypothesis of identical matrix (×210=78.99, p<0.000), the value of the determinant test was 0.34, and the internal consistency obtained in this dimension was also adequate.
Summary of factor loadings of the items of Dimension 1 (primary) of the FAI.
| Items | Dimension 1 |
|---|---|
| I1 Do you have difficulty opening your mouth wide? | 0.67a |
| I2 Do you have difficulty moving your jaw from side to side? | 0.71a |
| I3 Do you feel fatigue or muscle pain when chewing? | 0.74a |
| I6 Do you have earaches or pain in your TMJs? | 0.55a |
| I7 Have you noticed any clicking in your TMJs while chewing or opening your mouth? | 0.68a |
| Eigenvalue | 2.30 |
| % of variance explained | 46.08 |
| Cronbach's Alpha | 0.70 |
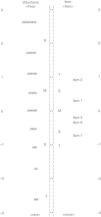
Table 4 shows the items’ fit index, with adequate values for infit and outfit (mean scores and z-scores). Regarding level of difficulty, item 2 had the highest index and item 7 the lowest. It is worth noting that none of the volunteers reached the maximum or minimum scores, and all volunteers were included in the analysis (n=94). The real reliability of items and volunteers was 0.63 and 0.87, respectively.
Fit index for the items in order of difficulty.
| Measure (θ) | Infit | Outfit | ||||
|---|---|---|---|---|---|---|
| MnSq | Zstd | MnSq | Zstd | |||
| I2 | Do you have difficulty moving your jaw from side to side? | 0.91 | 0.84 | −1.3 | 0.89 | −0.8 |
| I1 | Do you have difficulty opening your mouth wide? | 0.27 | 0.92 | −0.6 | 1.00 | 0.0 |
| I3 | Do you feel fatigue or muscle pain when chewing? | −0.18 | 0.83 | −1.3 | 0.90 | −0.6 |
| I6 | Do you have earaches or pain in your TMJs? | −0.29 | 1.24 | 1.6 | 1.17 | 1.0 |
| I7 | Have you noticed any clicking in your TMJs while chewing or opening your mouth? | −0.71 | 1.13 | 0.9 | 1.03 | 0.2 |
MnSq, mean-square; Zstd, Z-standardized; θ, theta (item's difficulty index).
Finally, Fig. 1 shows the map of the volunteers’ ability to respond (left) and the items’ difficulty (right). In general, the distribution of the estimates for ability to respond and item difficulty showed a concentration close to the area of the average value. It also shows a considerable number of volunteers with high ability to respond and absence of items that discriminate abilities that are very high or very low. The average ability of the volunteers (0.58±1.54 logit) was close to the average difficulty of the items (0.00±0.55 logit).
Discussion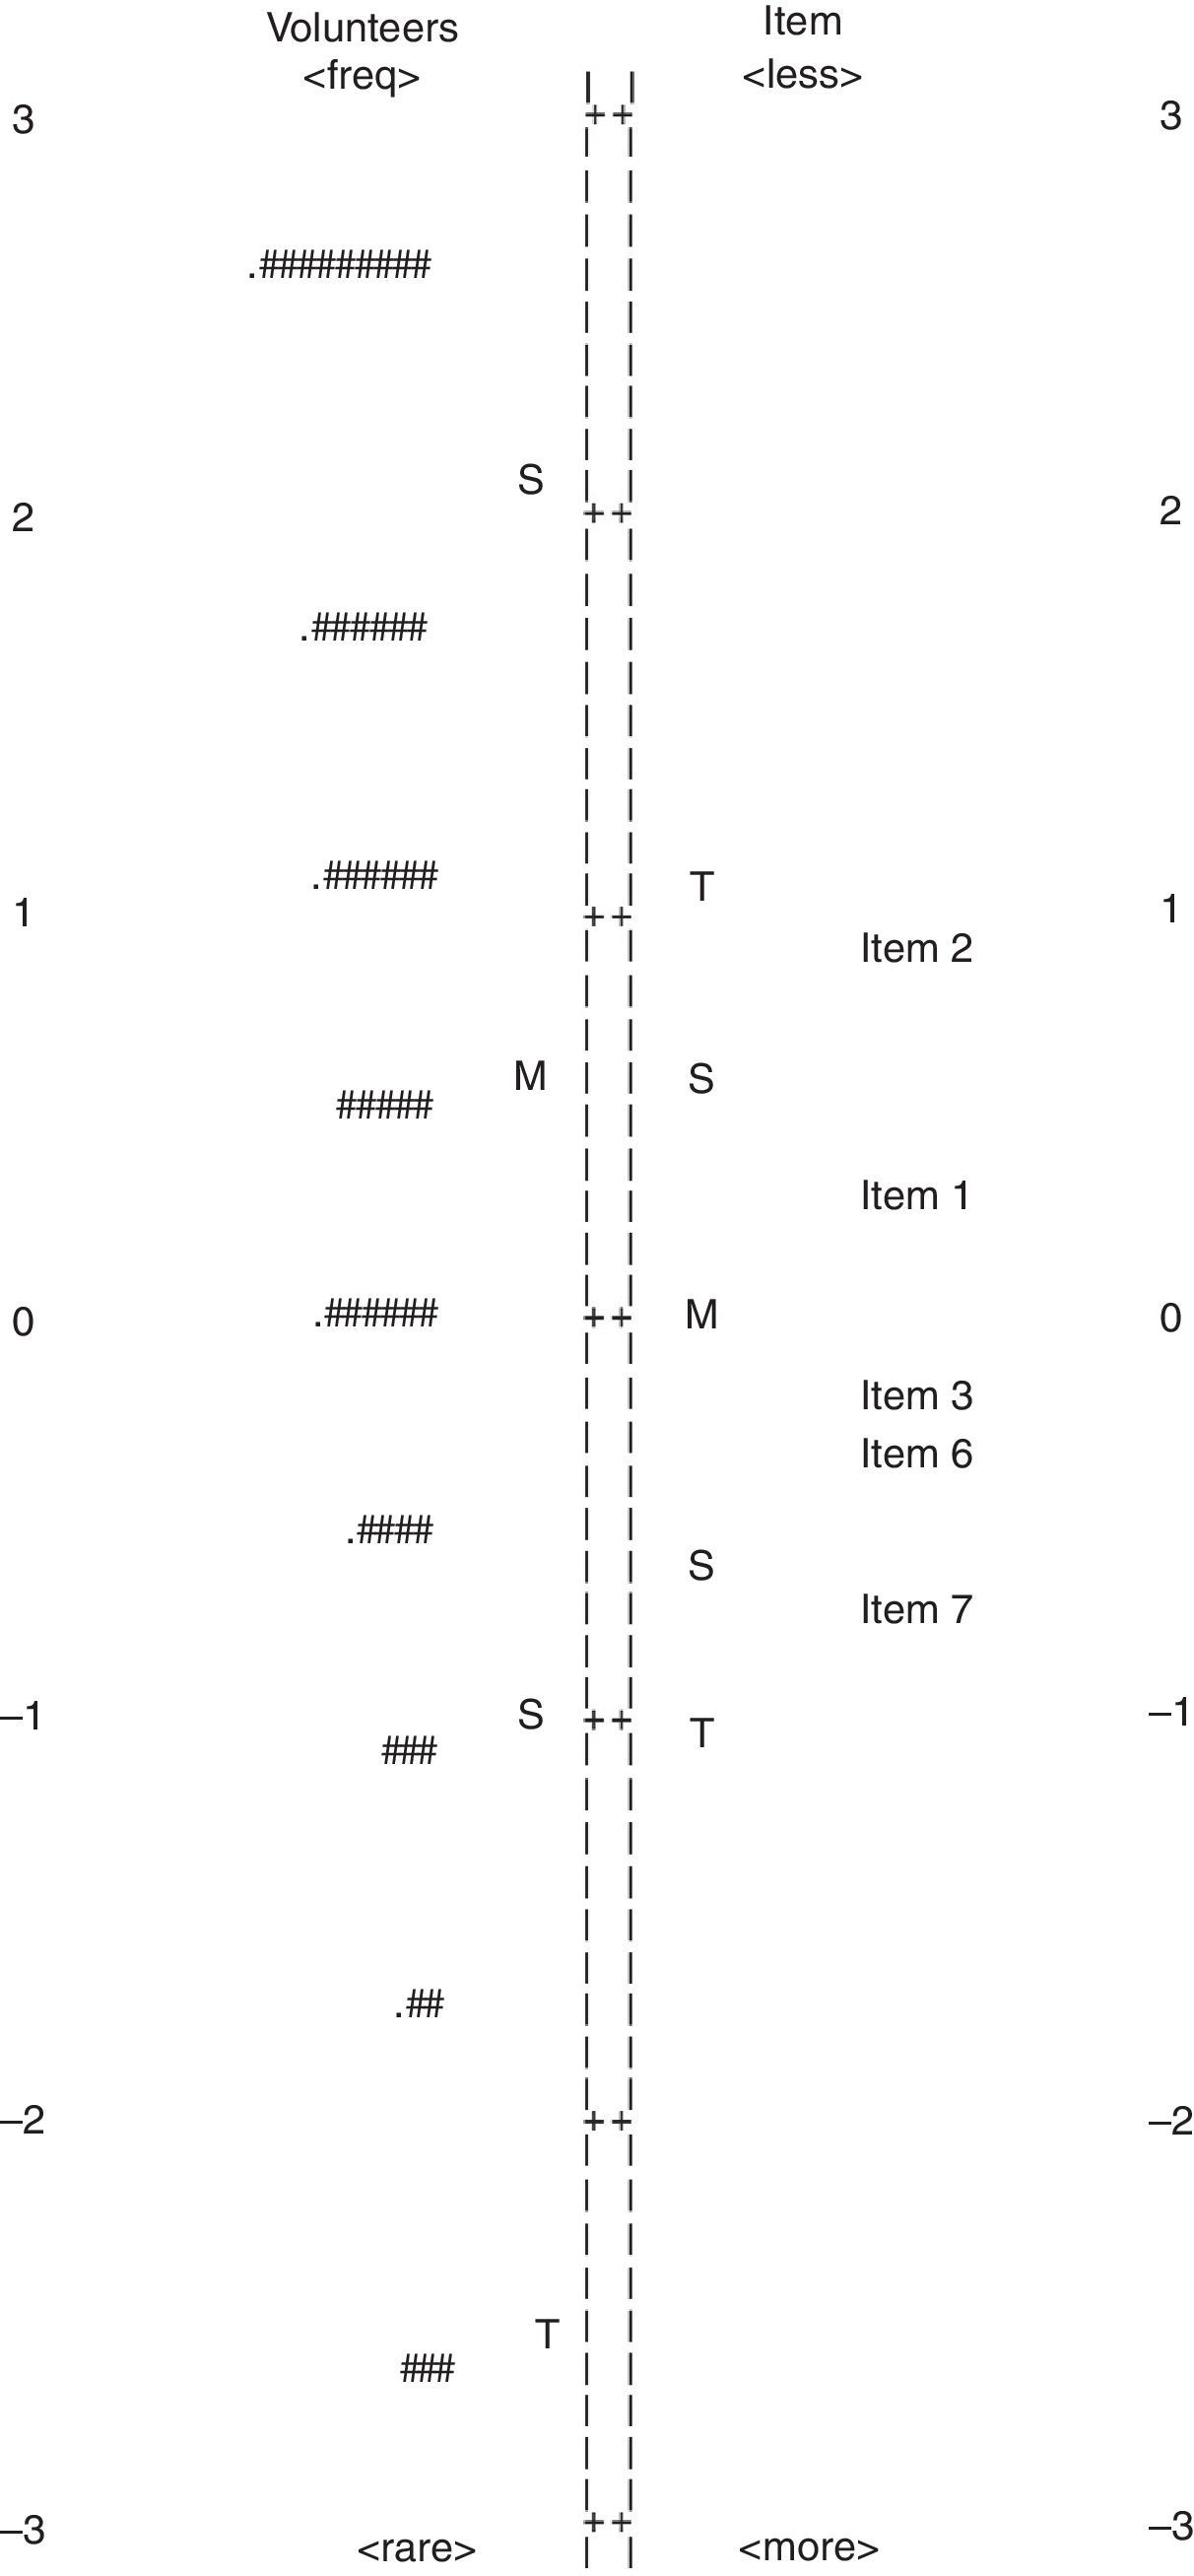
The results revealed that the present study has a basis for carrying out exploratory factor analysis, with good sampling adequacy, as well as well-fitting items in the primary dimension of the FAI, confirming its structural validity. Recent studies have emphasized the need for the use of exploratory factor analysis to confirm the dimensionality of a questionnaire, followed by internal consistency, with the purpose of evaluating its reliability.38,39 Nomura et al.25 suggested the multidimensionality of the FAI due to the various signs and symptoms measured by its items. Thus, the aforementioned studies corroborate the analysis performed in this study, which explores new data about the dimensions of the index, with its respective items grouped in 3 dimensions.
Some studies have found limitations in certain items of the FAI. Bevilaqua-Grossi et al.21 indicated items 4 and 5 (neck pain and headache), Lobezzo and Lavigne22 indicated items 8 and 10 (parafunctional habits and feelings of emotional stress), and Campos et al.,19 indicated items 4, 5, 8, 9, and 10 and suggested their exclusion due to their poor predictions for the diagnosis of the severity of myogenous TMD. In this sense, the above authors corroborate the present study, which only considered the analysis of the psychometric characteristics for dimension 1 (items 1, 2, 3, 6, and 7).
Other measurement properties of the FAI were also studied by Berni et al.18 The authors found high accuracy for the diagnosis of myogenous TMD, which also corroborates the findings of this study, as dimension 1 was able to measure 70% of the myogenous TMD symptoms in the study population (Cronbach's alpha=0.70) and explain 46.08% of the variance of the FAI. However, it is important to emphasize the importance of conducting a new accuracy analysis including only the items that formed dimension 1, since Berni et al.,18 conducted the accuracy analysis with all of the items.
With regard to the Rasch analysis, the present study showed new data on the hierarchy of the items of the FAI expressed in order of difficulty: Item 2, 1, 3, 6, and 7. It is noteworthy that all items evaluated showed adequate fit to the model without significant residuals and adequate infit and outfit values, excluding the possibility of erratic or deterministic scores. According to the adequate mean-square values, between 0.6 and 1.4,36,37 the present study demonstrated adequate variations between 0.83 and 1.24, as well as adequate ZStd values with variations of −1.3 to 1.6, considering the acceptable predictability values between −1.9 and 1.9.36,37
The only limitation of the Rasch analysis in this study is that the items were not sufficient for a full assessment of the women with myogenous TMD who had very high or very low ability. It may be necessary to add items that can discriminate such patients on both extremes points of the continuum of the scale. However, good real reliability of items and volunteers was found.
Finally, although the FAI was created to analyze the severity of the TMD, this scoring system has been set arbitrarily. For example, if a respondent answers “yes” to the items that made up dimension 2 or 3, they would get a mild TMD classification with a possible false positive classification. Thus, the present study shows the importance of considering only the dimension 1 of the FAI as the items showed adequate fit to the model. However, future studies should be conducted to define a cutoff point for diagnosis of myogenous TMD.
Therefore, we believe that the FAI is a Brazilian questionnaire that can be widely used by health professionals to evaluate patients with myogenous TMD, given that it is affordable, quick, and easy to apply even over the telephone19 with high accuracy, sensitivity, and specificity and with adequate fit for evaluating individuals with myogenous TMD.18 Unlike the DC/TMD, the FAI is a simple instrument that does not require assessor training or extensive evaluation time, which often precludes a prior assessment for screening patients. We also suggest that this instrument be used for follow-up of the effects of different therapeutic procedures, especially physical therapy; however, further research should be carried out using the FAI to monitor the effects of treatments on myogenous TMD.
This study has some limitation that should be pointed out. First, the structural findings should not be extrapolated to other TMD subtypes as the levels of internal consistency and fit were analyzed only in individuals with myogenous TMD, which makes the interpretation of the findings for other less prevalent subtypes of TMD arguable. Second, the FAI is a Brazilian questionnaire that, to date, does not have versions in other languages, which restricts its application to the Brazilian population and limits comparisons with international literature.
Other limitations are the absence of measurements of the reliability and responsiveness of the FAI for myogenous TMD and the lack of measurement accuracy considering only the items that formed dimension 1 of the FAI, which could clarify a cutoff point and proper scoring for the index. However, despite its limitations, this study presents significant measurement properties for a Brazilian questionnaire that can be used in well-defined clinical trials and prevalence studies in the field of physical therapy in individuals with myogenous TMD.
ConclusionThe hypothesis of the study was confirmed, as the FAI showed multidimensionality, with dimension 1 (primary) consisting of five reliable and well-fitting items for the composition of its structure. Items 1, 2, 3, 6, and 7 formed the primary dimension, with items 2 and 7 being considered the most difficult and the easiest items, respectively, for the diagnosis of women with myogenous TMD.
Conflicts of interestThe authors declare no conflicts of interest.