
Chronic back pain (CBP) can negatively affect one’s quality of life and health condition, posing significant social and economic burdens.
Objectives(1) To determine the prevalence of CBP and analyze associated factors in adult and elderly individuals in a municipality in southern Brazil; (2) to verify who sought medical attention or missed work because of back pain; and (3) to estimate the impact of CBP on selected health outcomes.
MethodsThis was a population-based cross-sectional study conducted with individuals aged 18 years and older. CBP was defined as “pain for three consecutive months in the cervical, thoracic, or lumbar regions in the last year.” Demographic, socioeconomic, behavioral, and physical and mental health information was collected. The impact of CBP was assessed by the etiological fraction method.
ResultsThe prevalence of CBP was 20.7% (95% CI: 18.3, 23.0) among the 1300 study participants. The factors associated with CBP were women, elderly, smokers, obesity, and sleeping fewer hours per night, as well as those with higher mental stress levels, history of fracture, arthritis/rheumatism, and work-related musculoskeletal disorder/repetitive strain injury. One-third of those with CBP missed work (31%) and 68% visited the physician over a 12-month period. All health outcomes analyzed (poor or very poor sleep quality, regular or poor health perception, worsened quality of life, depressive symptoms, perceived sadness) were significantly associated with CBP.
ConclusionOne in five adults or elderly reported having CBP over the previous 12 months. This condition was associated with poorer health perception, poorer quality of life, and depressive symptoms.
Back pain is commonly termed non-specific as it is characterized by a range of biophysical, psychological, and social dimensions.1 When this condition persists beyond normal healing time, it can be regarded as chronic back pain (CBP). According to the International Association for the Study of Pain (IASP), acute and chronic pain are differentiated based on a three-month cutoff point in the occurrence of the symptoms.2
CBP can be highly disabling and cause significant social and economic burdens as it is one of the main reasons for work absenteeism3,4 and disability.4,5 The costs related to the occurrence of CBP can be direct (healthcare assistance) and indirect (work absenteeism and unproductivity).6,7 In 2016, in the United States, indirect costs related to CBP reached 85% of expenses for the economy.6 In Brazil, in the same period, the economic burden of CBP to the healthcare system accounted for approximately 70% of hospitalizations and 65% of direct costs.7
CBP has been associated with poorer quality of life8 and poor sleep.9 Nevertheless, the impact of CBP on other health outcomes remains to be determined. There remains conflicting information in the literature regarding some factors associated to CBP, for instance, lower educational level,10,11 age,11,12 obesity,11–13 and smoking.11,14 Furthermore, other variables, such as hours of sleep9 and history of fracture15 are still poorly studied or just described. In addition, CBP can negatively affect an individual's quality of life and health status,8 implicating a social and economic burden,3,4 the identification of associated factors and prevalence of CBP is necessary to facilitate planning of specific preventive measures.16
We hypothesized that factors most associated with CBP are: older age, being a women, and having worse health conditions. Thus, this study aimed (1) to determine the prevalence of CBP and to analyze associated factors in adult and elderly individuals in a municipality in southern Brazil; (2) to determine the frequency of individuals with CBP who sought medical attention or missed work; and (3) to estimate the impact of CBP on some health outcomes.
MethodsThis was a population-based cross-sectional study conducted in the municipality of Rio Grande, a coastal city in the far south of the state of Rio Grande do Sul, Brazil, with approximately 200 000 inhabitants (96% of them living in urban areas). Rio Grande has a Human Development Index (HDI) of 0.744 according to 2010 population census data.17 This study was part of a project entitled “Health of the Riograndina Population”, which addressed various health aspects in this population. Further methodological information about this project is published elsewhere.18
The study sample consisted of individuals aged 18 years or older, residing in the urban area of Rio Grande. Individuals admitted to nursing homes, hospitals, or prisons, and those with physical and/or cognitive disabilities — unable to answer the questionnaire, were considered ineligible. The sample size was calculated considering a CBP prevalence of 18% (lowest prevalence found in a national study),19 proportion of the exposed group from 10%, prevalence ratio of at least 1.8, and minimum 80% statistical power, indicating a sample size of 888 individuals. An additional 25% was included for the design effect and another 15% for confounding factors, totaling a sample size of 1243 individuals. Lastly, an additional 10% were included for possible sample losses and dropouts, for a final desired sample size of 1332 individuals.
Two-stage sampling was used to obtain a representative sample of the urban population of Rio Grande. First, 72 (25%) census tracts were systematically selected based on the 2010 population census data, with probability proportional to the size of the sector. Second, a mean of 10 households per census tract was randomly selected, totaling 720 households. On average, there were two individuals aged 18 or older per household, which resulted in an estimated total of 1440 potentially eligible individuals.
Data were collected between April and July 2016 by previously trained interviewers who used a pre-coded questionnaire with closed questions. Field supervisors conducted telephone interviews with 10% of the sample to control the quality of the information and to address possible errors in the application of the questionnaire. A Kappa coefficient of 0.8 was obtained, which is considered substantial. Data were reviewed, coded, and double-entered by different examiners into EpiData version 3.1 software.
The outcome of interest was CBP, hereby defined as persistent pain (three months or more) in the cervical, thoracic, or lumbar regions in the previous year. The outcome was surveyed through the following questions:
- 1)
“Have you had back pain in the last 12 months, i.e., since
last year?”; - 2)
“Did such pain last more than 12 weeks, that is, three months in a row?”
Respondents had two answer options for both questions: “no” and “yes”. Respondents who answered positively to both questions were considered the numerator for calculating the prevalence of the outcome.
The independent variables investigated were sex (male; female), age group in years (18–39; 40–59; ≥60), skin color (white; other), marital status (single; married, divorced, or widowed), living alone (no; yes), schooling in full years (0–8; 9–11; ≥12), tertile asset index (lower; intermediate; higher),20 smoking (non-smoker; former smoker; smoker), leisure-time physical inactivity (no; yes), body mass index (BMI) (normal; overweight; obese), average sleep time per day (<6.0; 6.0–7.9; ≥8.0), tertile stress score (lower; intermediate; higher), history of fracture (no; yes), fall in the last year (no; yes), arthritis or rheumatism by medical diagnosis (no; yes), work-related musculoskeletal disorder/repetitive strain injury (WRMSD/RSI) (no; yes), chronic respiratory disease (no; yes), hypertension (no; yes). Information on work absenteeism in the last year because of back pain (no; yes) and seeking medical attention (no; yes) due to back pain were also collected. All variables were obtained by self-report.
The asset index variable considered household characteristics and ownership of some household goods through principal component analysis. After extraction, the first component explained 30.1% of the variability of all items (eigenvalue=3.31). The leisure-time physical inactivity variable was created based on the leisure section of the International Physical Activity Questionnaire (IPAQ)21 and defined as “individuals who performed no physical activity during their leisure time (zero minutes per week)”. BMI was calculated using self-reported weight and height data and then categorized into normal (up to 24.9kg/m2), overweight (25.0–29.9kg/m2), or obese (≥30.0kg/m2). The stress score was created based on the Perceived Stress Scale (PSS)22 and divided into tertiles. PSS score ranges from 0 to 56 points.
The variables considered as possible outcomes of CBP for calculating the Attributable Fraction or Etiological Fraction (EF) were: (1) poor or very poor sleep quality; (2) regular or poor health perception; (3) worsened quality of life; (4) depressive symptoms; (5) perceived sadness. Sleep quality was assessed by the question “How do you rate your sleep?” The following answers were possible: “very good”, “good”, “fair”, “poor”, and “very poor”. Health perception was surveyed through the following question: “Overall, how do you see your health”, with the possible answers: “excellent”, “very good”, “good”, “fair”, and “poor”.
Quality of life was measured by the WHOQOL-bref23 instrument of the World Health Organization (WHO). Subsequently, the standardized quality of life score was divided into quintiles, with the first quintile indicating the worst quality of life. Depressive symptoms were assessed by the Patient Health Questionnaire (PHQ-9)24 and dichotomized into “yes” or “no” based on the 9-point cutoff. Perceived sadness was defined by the face scale25 with those individuals who related themselves to the last three faces (sad, very sad, or extremely sad) being considered as sad.
Statistical analysisData were analyzed in STATA software version 11.2 (StataCorp LP, College Station, Texas, USA). Univariate analysis was performed using absolute and relative frequency to describe the sample according to each variable of interest. Bivariate analysis was used to calculate the prevalence of the outcome according to independent variables. Multivariate analysis was performed following a hierarchical model to determine the order of entry of the variables in the analysis.26 The hierarchical model was built on three levels: the first level included demographic and socioeconomic variables (sex, age, skin color, marital status, living alone, schooling, and asset index); the second level consisted of behavioral variables (smoking, leisure-time physical inactivity, sleeping hours, and stress score) and BMI; and the third level included health-related variables (history of fracture, fall in the previous year, arthritis/rheumatism, WRMSD/RSI, chronic respiratory disease, and hypertension). In each hierarchical level, variables associated with CBP with P-value ≤0.20 were maintained as possible confounding factors in the adjusted model.27 Poisson regression with robust variance adjustment was used to calculate the crude and adjusted prevalence ratios (PR) and their corresponding 95% confidence intervals (95% CI) and P values. The Wald test was used to check for heterogeneity (dichotomous or nominal exposures) and for linear trend (ordinal exposures). A significance level of 5% was considered for two-tailed tests.
Interactions related to sex, age range, and variables with P<0.10 were tested and described in the results. An analysis of individuals who sought medical attention and/or missed work because of back pain was also performed. Significant results (P<0.05) are reported in the text. All statistically significant variables associated with CBP were controlled in the CBP-related outcome analysis.
To assess the impact of CBP on each of five health outcomes, the Attributable Fraction or Etiological Fraction (EF) was calculated. This measure represents the maximum reduction of the associated disease if exposure to the population of interest was to be completely eliminated.28 The EF was calculated through the following formula:
Where, PO=prevalence of the outcome; PR=crude prevalence ratio.Ethical aspectsThis protocol for the study was approved by the Health Research Ethics Committee at the Universidade Federal do Rio Grande (FURG), Rio Grande, RS, Brazil under protocol no. 20/2016 (CAAE: 52939016.0.0000.5324). The ethical principles established by the National Health Council were followed according to Resolution 466/12. Study participants were informed of their right to refuse participation and on confidentiality procedures. Those who agreed to participate in the study signed an Informed Consent Form.
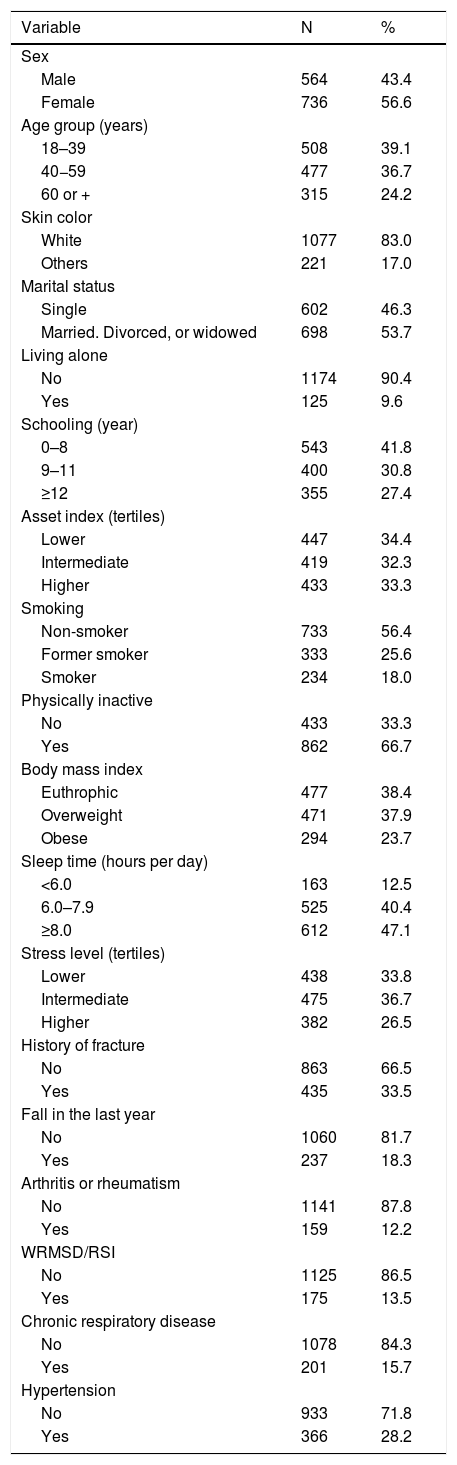
ResultsA total of 1300 out of 1429 eligible individuals participated in the study, which corresponded to a response rate of 91.0%. The effect of the sample design (ESD) for CBP was 1.08, that is, 8%. More than half of the respondents were females (57%), 83% had white skin color and 54% were married, divorced, or widowed. The average±standard deviation age was 46±17, ranging from 18 to 96 years. The median per capita household income was US$ 250 (interquartile range: 150, 440). Most respondents (90%) did not live alone and nearly half (42%) had 8 years or less of schooling. As for behavioral factors, 18% of the sample were smokers, 67% physically inactive, and 12% slept less than 6h a day. Nearly a quarter of the sample (24%) was obese, one third (33%) had a history of fracture, and 18% had fallen in the previous year. Hypertension was the most frequent morbidity (28%), followed by respiratory diseases (16%), WRMSD/RSI (14%), and arthritis/rheumatism (12.2%) (Table 1).
Characteristics of participants from Rio Grande, Brazil, 2016 (N=1300).
| Variable | N | % |
|---|---|---|
| Sex | ||
| Male | 564 | 43.4 |
| Female | 736 | 56.6 |
| Age group (years) | ||
| 18–39 | 508 | 39.1 |
| 40−59 | 477 | 36.7 |
| 60 or + | 315 | 24.2 |
| Skin color | ||
| White | 1077 | 83.0 |
| Others | 221 | 17.0 |
| Marital status | ||
| Single | 602 | 46.3 |
| Married. Divorced, or widowed | 698 | 53.7 |
| Living alone | ||
| No | 1174 | 90.4 |
| Yes | 125 | 9.6 |
| Schooling (year) | ||
| 0–8 | 543 | 41.8 |
| 9–11 | 400 | 30.8 |
| ≥12 | 355 | 27.4 |
| Asset index (tertiles) | ||
| Lower | 447 | 34.4 |
| Intermediate | 419 | 32.3 |
| Higher | 433 | 33.3 |
| Smoking | ||
| Non-smoker | 733 | 56.4 |
| Former smoker | 333 | 25.6 |
| Smoker | 234 | 18.0 |
| Physically inactive | ||
| No | 433 | 33.3 |
| Yes | 862 | 66.7 |
| Body mass index | ||
| Euthrophic | 477 | 38.4 |
| Overweight | 471 | 37.9 |
| Obese | 294 | 23.7 |
| Sleep time (hours per day) | ||
| <6.0 | 163 | 12.5 |
| 6.0–7.9 | 525 | 40.4 |
| ≥8.0 | 612 | 47.1 |
| Stress level (tertiles) | ||
| Lower | 438 | 33.8 |
| Intermediate | 475 | 36.7 |
| Higher | 382 | 26.5 |
| History of fracture | ||
| No | 863 | 66.5 |
| Yes | 435 | 33.5 |
| Fall in the last year | ||
| No | 1060 | 81.7 |
| Yes | 237 | 18.3 |
| Arthritis or rheumatism | ||
| No | 1141 | 87.8 |
| Yes | 159 | 12.2 |
| WRMSD/RSI | ||
| No | 1125 | 86.5 |
| Yes | 175 | 13.5 |
| Chronic respiratory disease | ||
| No | 1078 | 84.3 |
| Yes | 201 | 15.7 |
| Hypertension | ||
| No | 933 | 71.8 |
| Yes | 366 | 28.2 |
WRMSD/RSI: work-related musculoskeletal disorder/repetitive strain injury.
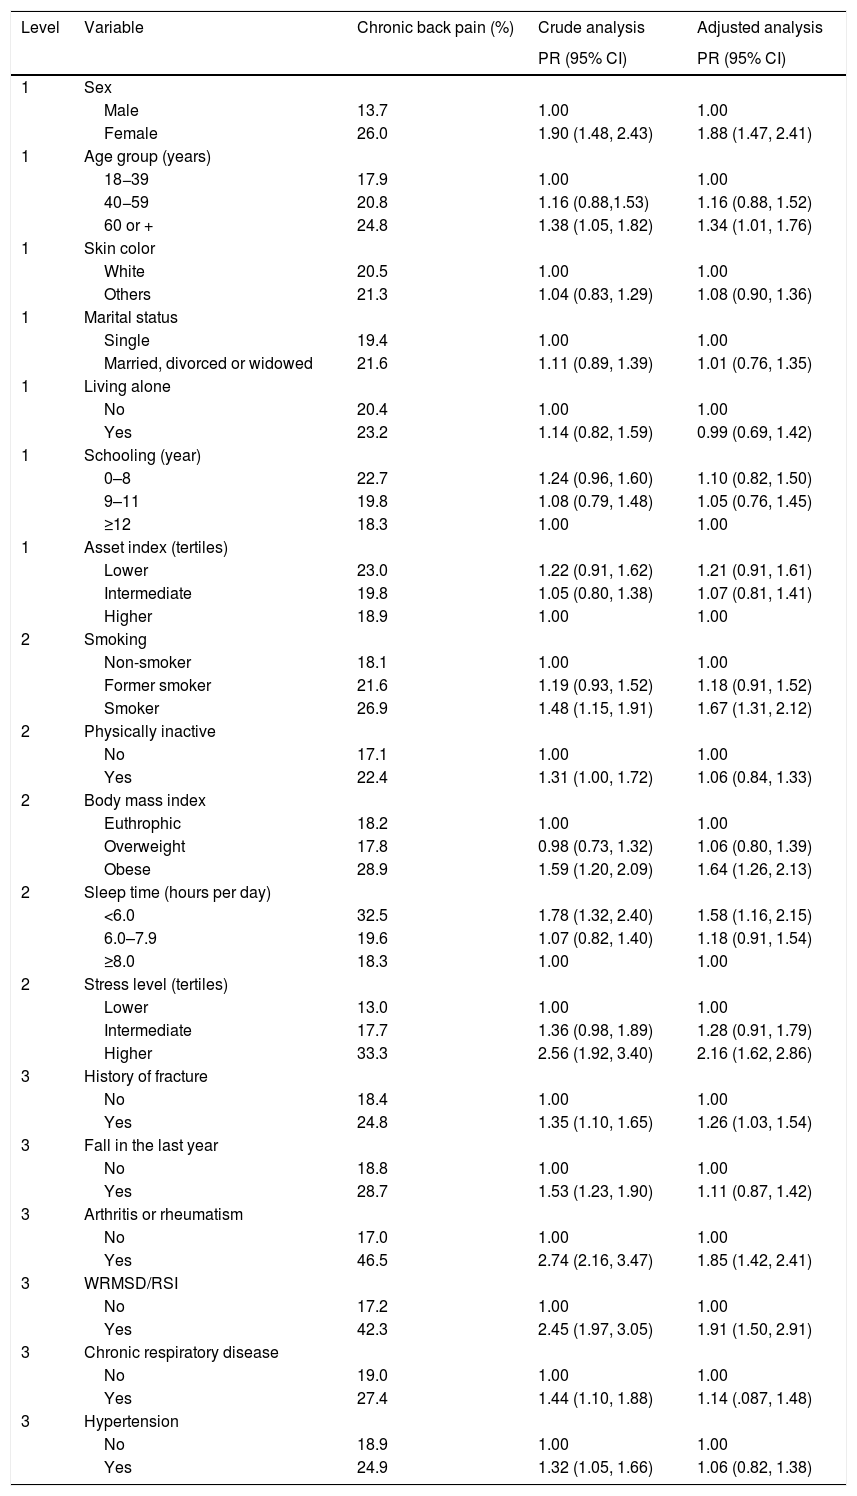
The prevalence of CBP was 20.7% (95% CI: 18.3, 23.0), ranging from 13% in individuals with lower stress level and 14% in males to 42% in individuals with WRMSD/RSI and 47% in those with arthritis or rheumatism (Table 2). The factors significantly associated with CBP in the crude analysis were: female sex, age of 60 or older, smoking, physical inactivity, obesity, less than 6h of sleep per day, higher stress level, history of fracture, fall in the previous year, arthritis/rheumatism, WRMSD/RSI, chronic respiratory disease, and hypertension (Table 2). Following adjustment for potential confounding factors, the variables physical inactivity, fall in the previous year, chronic respiratory disease, and hypertension, were no longer associated with CBP.
Crude and adjusted analysis of chronic back pain among adults and elderly from urban population of Rio Grande, Brazil, 2016 (N=1300).
| Level | Variable | Chronic back pain (%) | Crude analysis | Adjusted analysis |
|---|---|---|---|---|
| PR (95% CI) | PR (95% CI) | |||
| 1 | Sex | |||
| Male | 13.7 | 1.00 | 1.00 | |
| Female | 26.0 | 1.90 (1.48, 2.43) | 1.88 (1.47, 2.41) | |
| 1 | Age group (years) | |||
| 18−39 | 17.9 | 1.00 | 1.00 | |
| 40−59 | 20.8 | 1.16 (0.88,1.53) | 1.16 (0.88, 1.52) | |
| 60 or + | 24.8 | 1.38 (1.05, 1.82) | 1.34 (1.01, 1.76) | |
| 1 | Skin color | |||
| White | 20.5 | 1.00 | 1.00 | |
| Others | 21.3 | 1.04 (0.83, 1.29) | 1.08 (0.90, 1.36) | |
| 1 | Marital status | |||
| Single | 19.4 | 1.00 | 1.00 | |
| Married, divorced or widowed | 21.6 | 1.11 (0.89, 1.39) | 1.01 (0.76, 1.35) | |
| 1 | Living alone | |||
| No | 20.4 | 1.00 | 1.00 | |
| Yes | 23.2 | 1.14 (0.82, 1.59) | 0.99 (0.69, 1.42) | |
| 1 | Schooling (year) | |||
| 0–8 | 22.7 | 1.24 (0.96, 1.60) | 1.10 (0.82, 1.50) | |
| 9–11 | 19.8 | 1.08 (0.79, 1.48) | 1.05 (0.76, 1.45) | |
| ≥12 | 18.3 | 1.00 | 1.00 | |
| 1 | Asset index (tertiles) | |||
| Lower | 23.0 | 1.22 (0.91, 1.62) | 1.21 (0.91, 1.61) | |
| Intermediate | 19.8 | 1.05 (0.80, 1.38) | 1.07 (0.81, 1.41) | |
| Higher | 18.9 | 1.00 | 1.00 | |
| 2 | Smoking | |||
| Non-smoker | 18.1 | 1.00 | 1.00 | |
| Former smoker | 21.6 | 1.19 (0.93, 1.52) | 1.18 (0.91, 1.52) | |
| Smoker | 26.9 | 1.48 (1.15, 1.91) | 1.67 (1.31, 2.12) | |
| 2 | Physically inactive | |||
| No | 17.1 | 1.00 | 1.00 | |
| Yes | 22.4 | 1.31 (1.00, 1.72) | 1.06 (0.84, 1.33) | |
| 2 | Body mass index | |||
| Euthrophic | 18.2 | 1.00 | 1.00 | |
| Overweight | 17.8 | 0.98 (0.73, 1.32) | 1.06 (0.80, 1.39) | |
| Obese | 28.9 | 1.59 (1.20, 2.09) | 1.64 (1.26, 2.13) | |
| 2 | Sleep time (hours per day) | |||
| <6.0 | 32.5 | 1.78 (1.32, 2.40) | 1.58 (1.16, 2.15) | |
| 6.0–7.9 | 19.6 | 1.07 (0.82, 1.40) | 1.18 (0.91, 1.54) | |
| ≥8.0 | 18.3 | 1.00 | 1.00 | |
| 2 | Stress level (tertiles) | |||
| Lower | 13.0 | 1.00 | 1.00 | |
| Intermediate | 17.7 | 1.36 (0.98, 1.89) | 1.28 (0.91, 1.79) | |
| Higher | 33.3 | 2.56 (1.92, 3.40) | 2.16 (1.62, 2.86) | |
| 3 | History of fracture | |||
| No | 18.4 | 1.00 | 1.00 | |
| Yes | 24.8 | 1.35 (1.10, 1.65) | 1.26 (1.03, 1.54) | |
| 3 | Fall in the last year | |||
| No | 18.8 | 1.00 | 1.00 | |
| Yes | 28.7 | 1.53 (1.23, 1.90) | 1.11 (0.87, 1.42) | |
| 3 | Arthritis or rheumatism | |||
| No | 17.0 | 1.00 | 1.00 | |
| Yes | 46.5 | 2.74 (2.16, 3.47) | 1.85 (1.42, 2.41) | |
| 3 | WRMSD/RSI | |||
| No | 17.2 | 1.00 | 1.00 | |
| Yes | 42.3 | 2.45 (1.97, 3.05) | 1.91 (1.50, 2.91) | |
| 3 | Chronic respiratory disease | |||
| No | 19.0 | 1.00 | 1.00 | |
| Yes | 27.4 | 1.44 (1.10, 1.88) | 1.14 (.087, 1.48) | |
| 3 | Hypertension | |||
| No | 18.9 | 1.00 | 1.00 | |
| Yes | 24.9 | 1.32 (1.05, 1.66) | 1.06 (0.82, 1.38) |
WRMSD/RSI: work-related musculoskeletal disorder/repetitive strain injury.
PR: Prevalence ratio; 95% CI: 95% confidence interval.
The variable sex interacted significantly only with age and physical inactivity. In other words, the association between older age group (60 years or older) and CBP was found only in females, whereas the association between physical inactivity and CBP was significant only in males — and no longer observed after adjustment. The variable age interacted only with marital status, with a lower prevalence of CBP among not-single individuals aged 40–59 years.
Among the individuals with CBP (n=268), 31% (n=83) missed work and 68% (n=183) sought medical attention due to painful symptoms. The frequency of work absenteeism was higher in the following groups: individuals living alone, with lower socioeconomic status, with higher stress level, and diagnosed with WRMSD/RSI. Meanwhile, the frequency of individuals who sought medical attention was higher among elderly, single individuals, and among those with arthritis or rheumatism.
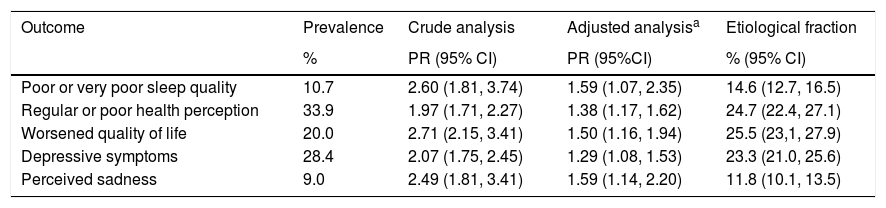
The association between CBP and health-related outcomes is shown in Table 3. The prevalence of poor or very poor sleep quality was 11%; 34% of the sample perceived their health as fair or poor; one fifth (20%) were within the group with the poorest quality of life; 28% had depressive symptoms; and 9% felt sad or very sad. All outcomes were significantly associated with CBP in both the crude and adjusted analyses (Table 3). The EF ranged from 12% for perceived sadness and 15% for lesser sleep quality to 23% for depressive symptoms, 25% for poor health perception, and 26% for lower quality of life score.
Association of chronic back pain with possible outcomes and the respective etiological fraction among adults and elderly from Rio Grande, Brazil, 2016 (N=1300).
| Outcome | Prevalence | Crude analysis | Adjusted analysisa | Etiological fraction |
|---|---|---|---|---|
| % | PR (95% CI) | PR (95%CI) | % (95% CI) | |
| Poor or very poor sleep quality | 10.7 | 2.60 (1.81, 3.74) | 1.59 (1.07, 2.35) | 14.6 (12.7, 16.5) |
| Regular or poor health perception | 33.9 | 1.97 (1.71, 2.27) | 1.38 (1.17, 1.62) | 24.7 (22.4, 27.1) |
| Worsened quality of life | 20.0 | 2.71 (2.15, 3.41) | 1.50 (1.16, 1.94) | 25.5 (23,1, 27.9) |
| Depressive symptoms | 28.4 | 2.07 (1.75, 2.45) | 1.29 (1.08, 1.53) | 23.3 (21.0, 25.6) |
| Perceived sadness | 9.0 | 2.49 (1.81, 3.41) | 1.59 (1.14, 2.20) | 11.8 (10.1, 13.5) |
PR: Prevalence ratio; 95% CI: 95% confidence interval.
This study recruited a representative sample of the adult and elderly population and had a low percentage of sample losses and refusals (9.0%), which allowed us to obtain statistically valid data for the subgroups. The prevalence of CBP found in this population was 20.7% (95% CI: 18.3, 23.0) and was associated with females, elderly, smokers, obesity, poor sleep, a history of fracture, and WRMSD/RSI.
The results of this study were consistent with data from studies conducted in Germany (21%)29 and São Paulo, Brazil (22%).14 Another relevant study,19 used data from the 2013 National Health Survey (PNS in Portuguese), which assessed CBP across all states of Brazil. The authors reported a CBP prevalence of 18.5%, which is very similar to that observed in our study. Importantly, different classifications for CBP have been proposed in the literature, as follows: over 7 days,10 7 weeks or more,11 3 months or more,12,14,30 previous 12 months,13,29,31 or solely an indication of CBP.8,9,19 Hence, different prevalence ratios of CBP have been reported worldwide (from 15.4% to 75.5%)8,10,13,29,30 and in Brazil (from 18.5% to 82.9%).9,11,12,14,19 Such variability may be due to different methods for defining the outcome(s), age groups, research instrument, and methods used for data acquisition.9
Previous studies have shown that women are more likely to develop CBP than are males,8–14,19,29,30 which is consistent with our findings. Females were almost twice as likely to have CBP as compared to males.
Despite being frequent at all ages, CBP was associated with the age group 60 years and older, with a statistically significant P values observed only for females. However, the literature mentions that the same changes also occur in men32 and our findings do not show a causal relationship between aging and CBP in men. In addition, the middle-aged population is more affected by CBP, although in the elderly CBP is more severe.32
Consistent with other studies,10,30 a greater percentage of smokers (26.9%) reported having CBP when compared to non-smokers (18.0%). These results can be explained by the deleterious effects of smoking on the musculoskeletal system through mechanisms such as increased of osteoporosis and fractures, decreased bone density, and more frequent degenerative changes in the spine.3 Some authors suggest a reduction in extracellular matrix in the intervertebral disc nucleus, which could progress to intervertebral disc degeneration.33
Another important associated factor for CBP was obesity. Obese individuals had a 64.0% higher probability of having CBP in comparison with those classified as non-obese. In addition to exerting mechanical effects that cause intervertebral disc degeneration, obesity seems to influence intervertebral disc homeostasis through adipokine-mediated inflammatory effects, especially leptin and adiponectin.34 A study35 showed that leptin increases the production and expression of degrading and pain-generating molecules by intervertebral disc cells, which may potentiate the degenerative process. Collectively, these findings provide evidence on a possible biochemical link between intervertebral disc degeneration, back pain, and obesity.
The literature presents little evidence related to sleep and CBP.9 Our findings showed that more than a third of the population who slept less than six hours a night had CBP. A study36 showed that people with CBP have poorer sleep quality and higher levels of insomnia as compared with healthy controls, i.e., those with CBP may potentially suffer from sleep disorders. This is consistent with what was observed in our study, where a strong association between few hours of sleep and CBP was observed. However, answering whether poor sleep is a cause or consequence of CBP remains elusive.
The factor most strongly associated with CBP was higher stress level, in that individuals who were more stressed were more than twice as likely to develop CBP than those reporting a lower stress level. Consistent with this, a study37 conducted in 43 low- and middle-income countries reported that higher levels of stress sensitivity were significantly associated with back pain or CBP.
Consistent with other reports,9,38 arthritis/rheumatism and WRMSD/RSI were the most prevalent CBP-related conditions, which remained associated even after adjustment. These conditions can aggravate the symptomatology of CBP and cause functional limitations and disabilities, thereby affecting the individual’s quality of life and leading to work absenteeism. Individuals experiencing CBP seek health care more frequently and, therefore, they account for increased economic burden to the public healthcare system.3,7,38
Currently, CBP is considered one of the leading causes of work absenteeism.3,4 In our study, one in three participants with CBP missed work due to pain. Direct (health care) and indirect (work absenteeism and unproductivity) costs6,7 related to CBP could be dramatically reduced if preventive measures were implemented. Education and physical exercises have been reported as the most effective measures both in the prevention of CBP and in reducing its worsening.39 Beliefs and attitudes are not learned intentionally, so the indirect message of an educational program can influence someone’s attitudes and beliefs.40
The impact of CBP on some health outcomes is one of the strengths of this study. If complete elimination of CBP from this population was possible, parameters such as worsened health perception, poor quality of life, and the prevalence of depressive symptoms could be reduced by 25%. These results provide an idea of how much the burden to healthcare services, cost of medicines, and withdrawal from social activities, work, and leisure, could be reduced if individuals with CBP could be effectively treated. But, no solution will be effective without the collaborative efforts of people with CBP, policy makers, doctors, physical therapists and researchers to develop and implement effective interventions.39
This study also has important limitations to consider. First, its cross-sectional design does not allow establishing any temporality relationship between the events and, thereby, may be subjected to reverse causality bias. For instance, it is possible for more stressed individuals to develop back pain, but the opposite may also be true. Second, the pain assessment performed in our study did not consider information on pain intensity or duration and no clinical examination to validate whether individuals had CBP was conducted. Lastly, the extrapolation of the results to the general population should be interpreted with caution. The majority of the population had, for example, white skin color and were from urban zone, which may differ from other municipalities in Brazil and in the world.
Longitudinal studies are recommended to better understand the causes and consequences of CBP and to identify the factors contributing to greater susceptibility and severity of this condition in the population.
ConclusionThe prevalence of CBP in this study was 20%. Our exploratory analyses showed that CBP was associated with stress, poor sleep, female sex, elderly, smokers, and obesity. One in three individuals with CBP missed work and two in three individuals sought medical attention within a 12-month period. CBP can contribute significantly to poorer health perception, poorer quality of life, and depressive symptoms.
Conflicts of interestThe author declares no conflicts of interest.
E Saes-Silva, YP Vieira, E Cousin received scholarships from CAPES (Coordination for the Improvement of Higher Education Personnel, Brazil). SC Dumith is a research productivity fellow at the CNPq (National Council for Scientific and Technological Development, Brazil). This study was funded by FAPERGS (Foundation for Research Support of the State of Rio Grande do Sul – FIRST PROJECTS PROGRAM – ARD/PPP 2014), under grant number 16/2551-0000359-9.


