

Cognitive, sensory, and biomechanical factors may affect gait of older adults. Among biomechanical factors, reduced pelvis and trunk range of motion (ROM) were associated with slower gait speed, shorter step length, and increased susceptibility to fall in older adults.
ObjectiveTo systematically review the studies that compared trunk and pelvic movement during gait among adults and older adults.
MethodsElectronic search was conducted on MEDLINE, EMBASE, and Cinahl from inception until May 2020. Studies that compared trunk and/or pelvis kinematics during gait between adults and older adults were included. The following data were extracted from studies: gait speed, walking surface, and pelvis trunk ROM during gait in the three planes of motion. Meta-analyses were calculated for slow, comfortable, and fast gait speeds using random effects models. GRADE determined the strength of evidence.
ResultsTwelve studies were included in this review. There was moderate-quality evidence that older adults have reduced pelvic rotation ROM at comfortable speed (SMD = −0.90 [−1.35, −0.45]) and high-quality evidence that older adults also have reduced pelvic rotation ROM at fast walking speed (SMD = −1.55 [−3.43, −0.33]). In addition, there was low-quality evidence that older adults have reduced trunk rotation at fast walking speed (SMD = −0.63 [−1.23, −0.03]). There were no differences for pelvic and trunk movement in the sagittal and frontal planes.
ConclusionThere is low to high quality of evidence that older adults walk with less pelvic rotation ROM in comfortable and fast walking speeds, and less trunk rotation ROM during fast walking speed.
The impact of aging on gait is frequently discussed in the literature. Aging reduces muscle strength, joint mobility, physical conditioning, and static and dynamic balance,1–4 which negatively influences walking ability.5 Previous systematic reviews showed that aging affects spatiotemporal, kinematic, and kinetic variables during gait.1,6 Herssens et al.6 demonstrated that gait of older adults is characterized by decreased walking speed, cadence, and step and stride length. In addition, Boyer et al.1 demonstrated that older adults have smaller knee and hip extension angles during mid-stance, and smaller hip extension and ankle plantar flexion angles during toe-off than adults. These changes in gait kinematics may be associated to a decline in older people’s walking performance that can compromise, for instance, their independence and ability to socialize within their neighborhood.1,5,7,8
Existing research focuses mainly in lower limb alterations during gait. But, it has been hypothesized that the decline in gait efficiency seen in older adults might also be due to altered pelvic and trunk kinematics.9,10 Given that pelvis, trunk, head, and arms (i.e. the upper body) correspond to approximately 50% of the total body mass,11 altered pelvic and trunk movement patterns during gait may explain part of the gait spatiotemporal changes in older adults, such as the reduced stride length and larger base of support.12 These altered movement patterns may result from deficits in trunk function often seen in older people, including reduced intervertebral mobility13 and trunk muscles weakness.10,14 Hyperkyphosis is one common postural alteration found in this population.15 Increased thoracic and lumbar kyphosis displaces the trunk center of mass (COM) forward and may consequently lead to a compensatory lower limb pattern of reduced hip extension and increased knee flexion and ankle dorsiflexion. In addition, trunk and pelvic changes may also contribute to reduced stability in older adults during gait. For example, Shishov et al.9 demonstrated that older adults with falls history are unable to properly increase pelvis and trunk range of motion (ROM) when challenged to walk faster on a treadmill.
Despite the growing number of studies investigating pelvic and trunk movement during gait in older adults,4,10,14,16,17 there is no consensus on the changes that occur with aging and how these changes relate to altered gait speed. A systematic review with meta-analysis provides a quantitative approach to combine results from multiple studies. Findings from a systematic review are more robust and may help to clarify the effects of aging on the movement patterns of the trunk and pelvis, and, therefore, provide better guidance to clinical gait assessment of older adults. Thus, the objective of this systematic review with meta-analysis was to compare the patterns of trunk and pelvic movement between adults and older adults during walking at three different speed ranges (slow, comfortable, and fast).
MethodsThis review was prospectively registered at PROSPERO (CRD42018107005) and followed the recommended methods from the Cochrane Collaboration18 and MOOSE reporting guidelines.19
Search strategyElectronic search was conducted by two reviewers on MEDLINE, EMBASE, and CINAHL (via Ovid), from inception to May 2020, without language or publication date restriction. Hand search was done through the reference lists of the relevant papers. The search strategy used the following key words: ‘aged’, ‘elder’, ‘old’, ‘adult’, ‘gait’, ‘walk’, ‘locomotor’, ‘ambulation’, ‘torso’, ‘trunk’, ‘pelvis’, ‘kinematics’, ‘kinetics’, ‘biomechanics’. The detailed search strategy is provided in supplementary material (Supplementary material online). The two reviewers were physical therapists enrolled in a master’s degree graduate program in rehabilitation sciences. Both reviewers were blinded to one another’s results of the retrieved studies. In case of disagreement, a third reviewer, a PhD trained physical therapy assistant professor, was consulted.
Inclusion criteriaIncluded papers were limited to those published in peer-reviewed journals. Original research studies comparing trunk and/or pelvis kinematics and kinetics during gait between healthy adults and older adults were included. We considered adults as being over 18 and lower than 60 years of age and older adults as being over 60 years of age. Research studies investigating trajectories of markers placed on the pelvis or trunk segment to convey coordination and stability measures were not included in this review. Studies with participants affected by any condition that could influence gait were also not included.
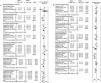
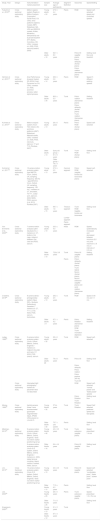
Data extraction and synthesisData extraction was performed by the first reviewer (ACC) and checked by the second reviewer (FOM), using standardized forms. The following data were extracted from each included study: author, date of publication, study design, instrumentation, marker set protocol, sample size, age of participants, pelvis and trunk angular displacement variables, gait speed, and type of walking surface: ground or treadmill (Table 1).
Characteristics of the included studies (total number = 12).
| Study, Year | Design | Instrumentation/ marker placement | Sample size | Average age of participants | Segment/ Definition | Outcomes | Speed/Setting |
|---|---|---|---|---|---|---|---|
| Fukuchi et al., 201830 | Cross sectional exploratory study | Motion capture system (Raptor-4; Motion Analysis Corporation, Santa Rosa, CA, USA), force platforms (Optima models AMTI; Watertown, MA, USA and 9281EA models; Kistler, Winterthur, Switzerland) and dual-belt treadmill (FIT; Bertec, Columbus, OH, USA) / markers on: ASIS, PSIS, sacrum(Leardini, 2009) | Young adults = 24 | 27.6 ± 4.4 years | Pelvis | ROM | Speed: self-selected speed and controlled speeds. |
| Older adults = 18 | 62.7 ± 8.0 years | Pelvic tilt (sagittal plane) | Setting: level floor and treadmill. | ||||
| Pelvic obliquity (frontal plane) | |||||||
| Pelvic rotation (transverse plane) | |||||||
| Gimmon et al., 201512 | Cross sectional exploratory study | Ariel Performance Analysis System 3D (APAS, Ariel Dynamics Inc.CA, USA)./ markers on: ASIS, acromion process, radial styloid process. | Young adults = 14 | 26.0 ± 0.9 years | Pelvis | ROM | Speed: 5 different walking speeds. |
| Older adults = 34 | 80.0 ± 5.3 years | Trunk | Pelvic rotation (transverse plane) | Setting: treadmill | |||
| Pelvic obliquity (frontal plane) | |||||||
| Trunk rotation (transverse plane) | |||||||
| Kulmala et al., 201031 | Cross sectional exploratory study | Motion analysis system (Vicon T40, Oxford, UK) and force platforms (AMTI, Watertown, Massachusetts, USA) / markers on: ASIS, PSIS, clavicula, sternum, T7 and T10. (Romkes, 2007) | Young adults = 13 | 26 ± 6 years | Pelvis | Pelvic ROM (frontal plane) | Speed: self-selected |
| Older adults = 13 | Early old group = 61 ± 5 years | Trunk | Trunk ROM (frontal plane) | Setting: level floor. | |||
| Older group = 78 ± 4 years | |||||||
| Schmid et al., 201732 | Cross sectional exploratory study | 12-camera motion analysis system (type MXT20, Vicon, Oxford, UK; sampling frequency: 200 Hz / type MXV612, Vicon, Oxford, UK; sampling frequency: 100 Hz). / markers on: C7, shoulders, T3-T11, costal arch, sternum, ASIS, MSIS, PSIS, sacrum (List, 2013; Romkes,2007) | Young aduts = 13 | 27.0 ± 2.5 years | Cervical segment | Pelvic ROM (sagittal, frontal and transverse plane) | Speed: self-selected |
| Older adults = 15 | 69.7 ± 1.8 years | Thoracic segment | Trunk ROM Sagittal, frontal and transverse | Setting: level floor | |||
| Lumbar segment | |||||||
| Pelvis segment | |||||||
| Van Emmerick et al., 200533 | Cross sectional exploratory study | 7-camera motion analysis sytem (Qualysis Inc.) / markers on: C7, bottom of rib cage, midpoint between iliac crest and PSIS, sacrum. | Young adults = 10 | 23.3 ± 4.0 years | Head | ROM | Speed: systematically increased and decreased between minimum (0.2 m/s) and maximum (1.8 m/s) in intervals of 0.2 m/s. |
| Older adults = 10 | 72.6± 3.8 years | Trunk | Pelvic tilt (sagittal plane) | Setting: treadmill | |||
| Pelvis | Pelvic obliquity (frontal plane) | ||||||
| Trunk lateral flexion (frontal plane), flexion-extension (sagittal plane) and axial rotation (transverse plane) | |||||||
| Crawford, 201834 | Cross sectional exploratory study | 8-camera stereo-photogrametry system (Oqus 300+, Qualysis Gothenburg, Sweeden) / markers on: C7, T11, L3, S2, ASIS, PSIS, sacrum, trochanters. | Young adults = 10 | 26.3 ± 2.5 years | Trunk | ROM | Speed: 0.55 m/s and 1.1 m/s |
| Older adults = 9 | 67.1 ± 4.2 years | Pelvis | Pelvic Rotation (transverse plane) | Setting: treadmill | |||
| ROM | |||||||
| Trunk inclination (biplanar) | |||||||
| Judge, 199635 | Cross sectional exploratory study | 3-camera motion analysis system (Vicon, Oxford Metrics, Oxford, England) / markers on: midpoint shoulder and neck, C7, ASIS, PSIS (wand), sacrum. | Young adults = 32 | 26 ± 6 years | Trunk | ROM | Speed: self- selected |
| Older adults: 26 | 79 ± 6 years | Pelvis | Pelvic tilt | Setting: level floor | |||
| Pelvic obliquity | |||||||
| Pelvic rotation | |||||||
| Pelvic posture (AP tilt) | |||||||
| Trunk tilt | |||||||
| Cross sectional exploratory study | Interrupted light photography / marker set placement was not described | ROM | Speed: self-selected “normal paced” and “faster paced” speeds | ||||
| Pelvic Rotation | Setting: level floor | ||||||
| Trunk Rotation | |||||||
| Murray, 196939 | Cross sectional exploratory study | Inertial sensors (three 3-axis accelerometer/ gyroscope/ magnetometer (Opal, APDM, USA) placed on L4 and L5. | Young Adults = 32 | 37.4± years | Trunk | Trunk Rotation | Speed: Self selected preferred speed and fast speed. |
| Older adults = 32 | 73.7 ± yea yyears | Pelvis | Setting: level floor | ||||
| Mirelman, 201540 | Cross sectional exploratory study | 9-camera motion analysis system (Vicon, Oxford Metrics, Oxford, England) / does not inform marker positioning set up | Young Adults = 46 | 45 ± 3.5 years | Trunk | Trunk extension (sagittal plane) | Speed: prescribed 1.4 m/s |
| 6-camera motion analysis system (Vicon 512 system, Oxford Metrics, Oxford, England) / markers on: ASIS, latetal femoral condyles, lateral malleoli, forefeet, heels, sacrum. | Older Adults = 16 | 64 ± 4.4 years | Pelvic tilt (sagittal plane) | Setting: level floor | |||
| Lim, 201337 | Cross Sectional exploratory study | 13-camera motion analysis system (Vicon 512 system, Oxford Metrics, Oxford, England) / does not inform marker positioning set up | Young Adults = 10 | 24 ± 2.5 years | Trunk | Pelvic tilt (sagittal plane) | Speed: self-selected “comfortable pace”, “faster pace”, “slower pace” |
| Older Adults = 10 | 71.5 ± 6.3 years | Pelvis | Setting: level floor | ||||
| Lee, 200536 | Young Adults = 25 | 26 ± 5 years | Pelvis | Trunk extension (sagittal plane) | Speed: prescribed 1.3 ± 3% m/s | ||
| Older Adults = 25 | 71 ± 5 years | Setting: level floor | |||||
| Krupenevic, 202038 | Young Adults = 13 | 21 ± 3 years | Trunk | ||||
| Older Adults = 12 | 67 ± 4 years |
N, sample size; AP, anteroposterior; ROM, range of motion; COM, center of mass; ±, standard deviation.
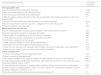
All included studies were assessed for risk of bias using an adapted version of a Quality Assessment Checklist used in previous reviews analyzing kinematics studies.20,21 The adaptations were made in regards to specificities of the population assessed. The quality assessment checklist is divided into three domains: study population bias, measurement and outcome bias, and data presentation bias (Table 2). The categorization suggested by Hootman et al.22 was chosen for this review: studies scored as high quality if it achieved a score >66.8%, medium quality for a score of 33.4–66.7%, and low quality for a score <33.3%. Assessment checklist questions and the corresponding decision rules on each question are available as Supplementary Material (Supplementary material online). Each included study was initially assessed by two independent reviewers and scored using the modified checklist. Subsequently, if required, a consensus score was reached after discussion.
Quality Assessment Summary.
| Quality assessment domains | % of studies scoring yes |
|---|---|
| Study population bias | |
| 1 Was the study population adequately described? | 100% |
| 2 Were both groups drawn from the same population? | 33% |
| 3 Were both groups comparable for sex, BMI/weight? | 58% |
| 4 Were the subjects asked to participate in the study representative of the entire population from which they were recruited? | 0% |
| 5 Was gait or functional level adequately described for the older adult group? | 41% |
| 6 Was an attempt made to define the age limit or categories for the older adult group? | 0% |
| 7 Were the eligibility criteria specified? | 75% |
| Measurement and outcome bias | |
| 8 Did the method description enable accurate replication of the measurement procedures? | 83% |
| 9 Was the measurement equipment adequately described? | 66% |
| 10 Was a system for standardizing movement instructions reported? | 66% |
| 11 Were assessors trained in standardized measurement procedure? | 0% |
| 12 Did the same assessors test both groups? | 0% |
| 13 Were assessors blinded as to which group subjects were in? | 0% |
| 14 Was assessment procedure applied to both groups the same? | 91% |
| 15 Were the main outcomes to be measured and the related calculations (if applicable) clearly described? | 91% |
| 16 Were the main outcome measures used accurate (valid and reliable)? | 75% |
| Data presentation bias | |
| 17 Are the main findings of the study clearly described? | 91% |
| 18 Were the statistical tests appropriate?* | 91% |
| 19 The results of between-group statistical comparisons were reported for at least one key outcome.* | 90% |
| 20 Have actual probability values been reported (e.g. 0.035 rather than <0.05) for the main outcomes except where the probability value is <0.001?* | 54% |
| 21 Point estimates and measures of variability were provided for at least one key outcome for both groups.* | 66% |
| 22 Did the study have sufficient power to detect a clinically important eff ;ect where the probability value for a diff ;erence being due to chance is <5%?* | 0% |
| 23 Was the reliability and/or validity of the outcomes commented upon?* | 0% |
Questions 18–23 were not applicable to Fukuchi et al. 30 due to specific study design. So, this study was not included in the total percentage.
Means and standard deviations for pelvic and trunk ROM were extracted for each group (i.e. adults and older adults). When numerical data were not available in tables or text, we contacted the authors to obtain the data of interest. If there were no response, we followed the Cochrane recommendations18 and extracted data from graphs, using GetData Graph Digitizer.23 Due to the low number of studies included, studies with different research settings were grouped in the same analysis. The main criterion used to categorize studies was gait speed. To investigate the influence of different gait speeds on the trunk and pelvic movement patterns, data extracted from studies testing different gait speeds were grouped into three categories: slow speed (0.49−0.90 m/s); comfortable speed (0.91–1.50 m/s), and fast speed (1.51–1.90 m/s). The choice of comfortable velocity was based on studies that determined reference values for the older adults population24,25 and studies investigating the speed required for community walking and ability to increase speed during functional activities.26 The slow and fast speed ranges were determined based on the speeds found in the included studies. Pooled estimates of overall differences were calculated by meta-analysis of studies that measured kinematic characteristics of trunk and pelvic motion using comparable methods. Studies were included if they used the same unit of measurement and if they described similar gait situations, for example, no use of dual tasks, perturbations, or assistive devices.
The differences in pelvic and trunk ROM between groups were calculated using standardized mean difference (SMD) and 95% confidence interval (CI). Means were standardized because of discrepancies between the use of markers and modelling of the pelvis and trunk segments in the included studies.27 SMDs were interpreted as small (SMD = 0.2 or −0.2), moderate (SMD = 0.5 or −0.5), or large (SMD = 0.8 or −0.8).19 The level of heterogeneity across studies was estimated with I2 statistics. Meta-analyses were calculated using random effects models in RevMan version 5.3.28
Assessment of quality of evidenceTo summarize the overall quality of the evidence, the GRADE system (Grading of Recommendations Assessment, Development and Evaluation)29 was used for each meta-analysis. Scoring of evidence started at high-quality evidence, which was downgraded one level if one of the following pre-specified criteria was present: (i) poor methodological quality (downgraded if ≥25% of the studies included in the meta-analysis used groups that were not comparable or lacked information on point estimates and variability in key outcomes (i.e., items 3 and 21 of the quality assessment scale); (ii) imprecision (downgraded if ≥25% of the included studies did not have sufficient power to detect a clinically important change [i.e., item 22 of the quality assessment scale]); (iii) indirectness (downgraded if ≥25% of the included studies did not use valid and reliable methods for data collection or did not specify if the study participants were representative of the population; and (iv) inconsistency (downgraded if there was wide variance of point estimates across studies and minimal or no overlap of CIs of different studies).
ResultsFlow of studies through the reviewThe electronic search strategy identified 1366 records from the selected databases (excluding duplicates). It was not necessary to ask authors for full text studies to be included, nor did we have to include any studies published in languages other than English. After screening titles, abstracts, and reference lists, 34 potentially relevant records underwent full-text review. Twenty-two studies failed to meet the inclusion criteria, and therefore 12 articles were included after full text review and subsequently in the meta-analysis (Fig. 1).
Characteristics of included studies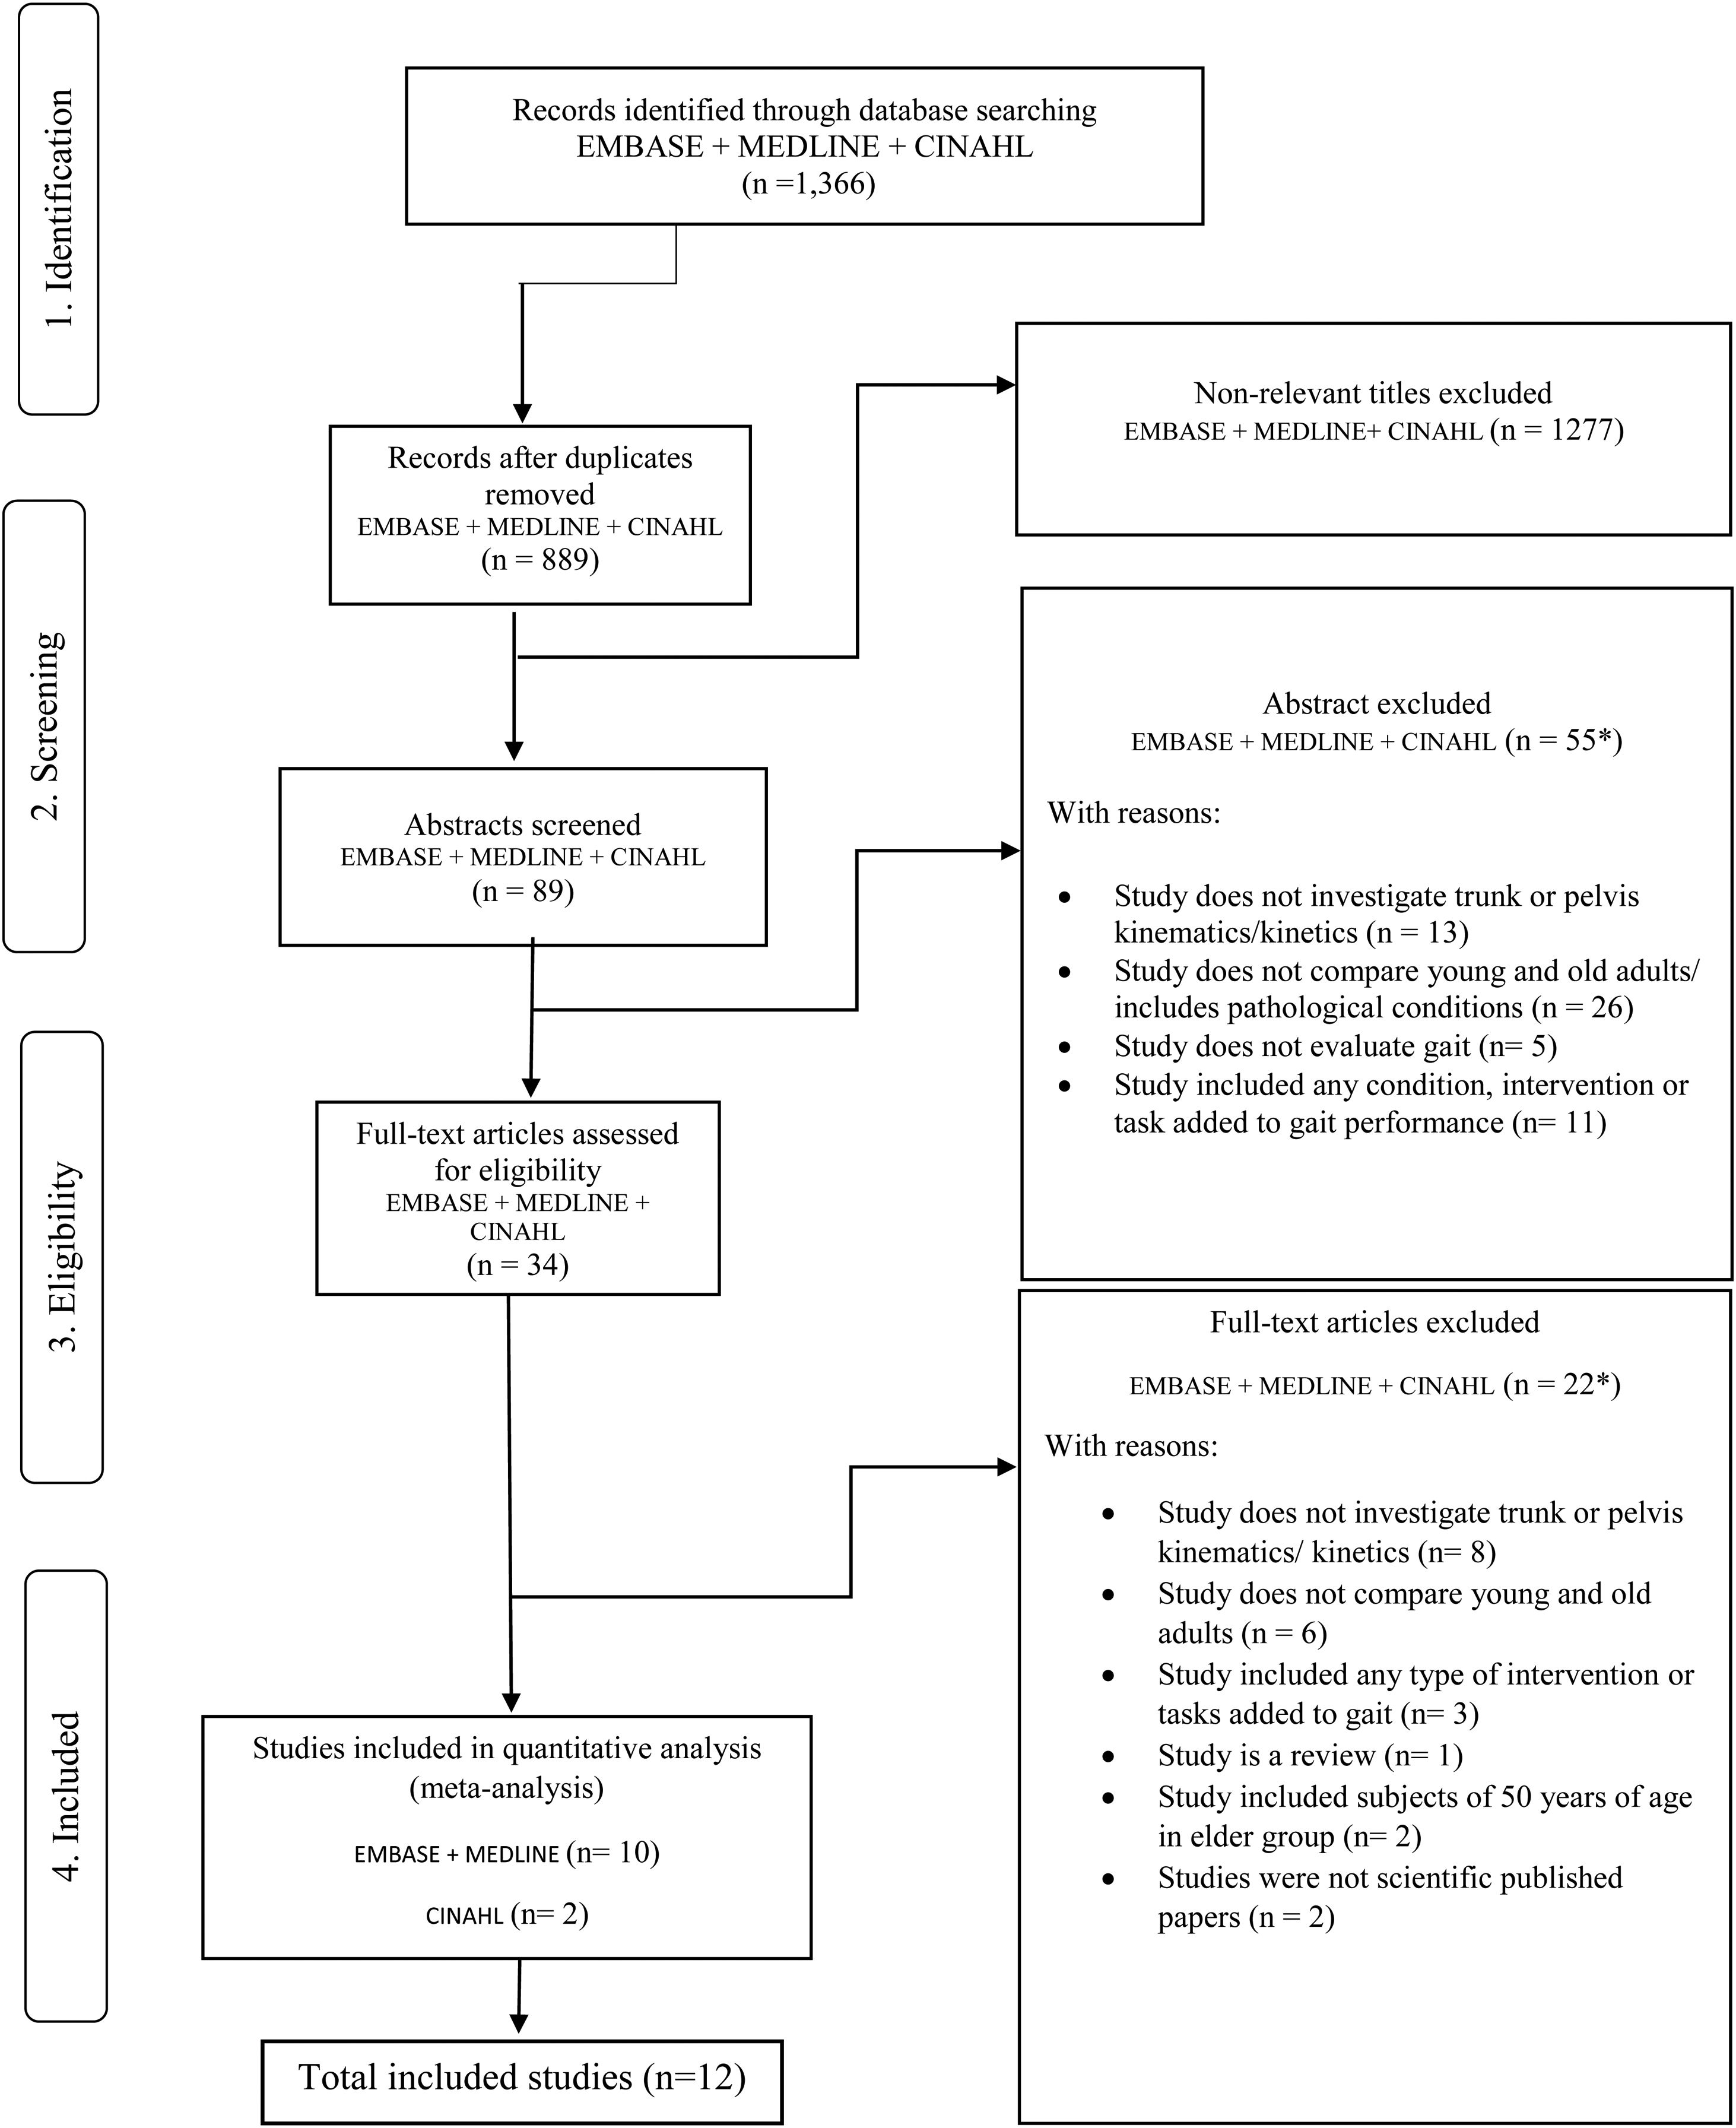
Table 1 presents the studies characteristics. The included studies were observational cross-sectional studies investigating gait parameters with motion capture systems. Ten studies used 3D systems,12,30–38 one used interrupted light photography,39 and one used inertial measurement units.39 Nine studies asked the participants to walk at self-selected or comfortable speed on level floor,31–38 and the other three studies asked the participants to walk at pre-determined speeds on the treadmill.12,33,34 Only one study30 asked the participants to walk on both, level floor and treadmill, at self-selected and pre-determined speeds. The data from this study were divided in data from participants who walked on level floor and treadmill for comparison purposes. No studies investigated kinetic variables or kinematic variables other than angular displacement.
Quality assessment of studiesMost studies were of moderate quality, scoring 33%–66%.12,30–35,37,40 Two studies35,38 scored high (69% and 74%) and one scored low (26%).39 The major sources of low score were lack of sample size calculation, sample selection, and description of functional status, lack of information on blinding, and training of the assessors. Potential sources of bias are summarized in Table 2.
ParticipantsA total of 426 participants (242 adults and 220 older adults) were included in the 12 studies for the meta-analysis. The mean age ranged from 21 to 45 years for the adults and from 60 to 87 years for the older adults.
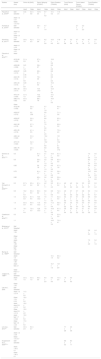
OutcomesNone of the included studies reported data on pelvis and trunk kinetics or kinematic variables other than angular displacement. Therefore, data analyses were conducted for kinematic data only. Table 3 summarizes data extracted from the included studies.
Speed, pelvic and trunk mean ± standard deviation range of motion during gait for each age group in the three planes of movement. Pelvic and trunk range of motion are reported in degrees.
| Studies | Speed (m/s) | Pelvic tilt (SAG) | Pelvic Obliquity (FRONT) | Pelvic Rotation (TRANS) | Trunk Flexion (SAG) | Trunk Lateral Flexion (FRONT) | Trunk Rotation (TRANS) | ||||||
|---|---|---|---|---|---|---|---|---|---|---|---|---|---|
| Adult | Older | Adult | Older | Adult | Older | Adult | Older | Adult | Older | Adult | Older | ||
| Fukuchi et al., 201830 | Self-selected | 3.3± 1 | 3.0 ± 0.8 | 10.7± 3.4 | 9.7 ± 4.2 | 14 ± 4.2 | 11.5 ± 4 | ||||||
| Adult: 1.2 ± 0.1 | |||||||||||||
| Older: 1.2 ± 0.2 | |||||||||||||
| Kulmala et al., 201631 | Self-selected | 4.0 ± 1.3 | 4.7 ± 1.4 | 2.7 ± 1.7 | 2.3 ± 2.3 | ||||||||
| Adult 1.6 ± 0.1 | |||||||||||||
| Older 1.6 ± 0.2 | |||||||||||||
| Schmid et al., 201732 | Self-selected | 3.8 ± 1.6 | 4.2 ± 2.3 | 7.1 ± 2.8 | 6.2 ± 2.6 | 12.0 ± 4.3 | 11.8 ± 4.5 | 3.4 ± 0.8 | 3.3 ± 0.9 | 3.7 ± 1.5 | 4.0 ± 1.8 | 6.7 ± 1.7 | 5.8 ± 2.3 |
| Adult 1.5 ± 0.2 | |||||||||||||
| Older 1.6 ± 0.1 | |||||||||||||
| Fukuchi et al., 201830** | Adult | ||||||||||||
| v01(0.49 ± 0.06) | 3.1 ± 0.9 | 5.7 ± 1.9 | 10.6 ± 3.9 | ||||||||||
| v02(0.68 ± 0.08) | 3.21 ± 1.2 | 5.6 ± 2.7 | 8.9 ± 2.8 | ||||||||||
| v03(0.87 ± 0.10) | 3.05 ± 0.78 | 6.6 ± 3.1 | 8.8 ± 2.4 | ||||||||||
| v04(1.05 ± 0.12) | 3.14 ± 0.8 | 7.5 ± 3.6 | 8.9 ± 2.2 | ||||||||||
| v05(1.24 ± 0.15) | 3.23 ± 0.9 | 8.1 ± 4.5 | 10.3 ± 2.9 | ||||||||||
| v06(1.43 ± 0.17) | 3.6 ± 1.0 | 10.4 ± 4.9 | 12.3 ± 4.5 | ||||||||||
| v07(1.61 ± 0.20) | 3.7 ± 1.2 | 10.2 ± 5.8 | 13 ± 5.3 | ||||||||||
| v08(1.8 ± 0.22) | 5.0 ± 3.8 | 8.8 ± 7.8 | 16.5 ± 5.2 | ||||||||||
| Older: | |||||||||||||
| v01(0.49 ± 0.06) | 2.6 ± 0.5 | 5.7 ± 1.9 | 9.0 ± 4.1 | ||||||||||
| v02(0.67 ± 0.10) | 2.5 ±0.8 | 5.6 ± 2.7 | 7.1 ± 3.8 | ||||||||||
| v03(0.87 ± 0.12) | 2.6 ± 0.5 | 6.6 ± 3.1 | 6.5 ± 3.1 | ||||||||||
| v04(1.06 ± 0.16) | 2.7 ± 0.6 | 7.5 ± 3.6 | 6.9 ± 3.2 | ||||||||||
| v05(1.25 ± 0.19) | 4.1 ± 3.5 | 8.1 ± 4.5 | 7.5 ± 4.0 | ||||||||||
| v06(1.44 ± 0.22) | 3.3 ± 0.7 | 10.4 ± 4.9 | 10.1 ± 4.3 | ||||||||||
| v07(1.61 ± 0.22) | 3.2 ± 1.4 | 10.2 ± 5.8 | 10.2 ± 5.1 | ||||||||||
| v08(1.76 ± 0.24) | 2.5 ± 2.1 | 8.8 ± 7.8 | 8.8 ±7.2 | ||||||||||
| Gimmon et al., 201512** | 0.5 | 5.1 ± 1.8 | 3.1 ± 1.3 | 10.4 ± 3.3 | 5.7 ± 2.2 | 7.3 ± 2.4 | 4.5 ± 1.9 | ||||||
| 0.6 | 5.5 ± 2.0 | 3.2 ± 1.3 | 9.9 ± 4.3 | 6.0 ± 2.2 | 8.2 ± 2.6 | 5.3 ± 2.3 | |||||||
| 0.65 | 5.6 1.8 | 3.2 ± 1.3 | 9.5 ± 3.5 | 5.7 ± 1.8 | 9.2 ± 2.8 | 6.0 ± 2.2 | |||||||
| 0.75 | 6.1 ± 1.7 | 3.1 ± 1.4 | 9.1 ± 2.9 | 5.6 ± 1.8 | 10.7 ± 3.4 | 6.9 ± 2.5 | |||||||
| 0.85 | 6.3 ± 1.7 | 3.2 ± 1.4 | 9.2 ± 3.2 | 5.9 ± 2.0 | 11.9 ± 4.3 | 7.5 2.6 | |||||||
| Van Emmerik* et al., 200533** | 0.2 | 8.7 ± 4.4 | 6.5 ± 4.4 | 6.1 ± 2.2 | 4.2 ± 1.1 | 9.5 ± 4.4 | 8.1 ± 4.4 | 4.9 ± 3.3 | 4.0 ± 4.4 | 3.4 ± 4.4 | 3.5 ± 4.4 | 9.3 ± 6.7 | 9.3 ± 4.4 |
| 0.6 | 10.2 ± 4.4 | 6.5 ± 4.4 | 9.0 ± 2.2 | 5.8 ± 1.1 | 8.8 ± 5.6 | 7.2 ± 4.4 | 4.9 ± 3.3 | 3.7 ± 3.3 | 3.7 ± 2.2 | 3.8 ± 2.2 | 9.3 ± 6.7 | 11.4 ± 6.7 | |
| 1.0 | 8.2 ± 3.3 | 6.7 ± 4.4 | 10.0 ± 2.2 | 7.5 ± 1.1 | 7.1 ± 3.3 | 6.3 ± 3.3 | 4.3 ± 3.3 | 3.7 ± 1.1 | 5.1 ± 2.2 | 4.6 ± 2.2 | 9.5 ± 4.4 | 9.8 ± 5.6 | |
| 1.4 | 9.0 ± 3.3 | 6.9 ± 4.4 | 11.5 ± 2.2 | 8.4 ± 1.1 | 11.2 ± 4.4 | 6.6 ± 3.3 | 3.5 ± 2.2 | 3.5 ± 2.2 | 5.3 ± 3.3 | 5.0 ± 3.3 | 8.7 ± 5.6 | 8.5 ± 5.6 | |
| 1.8 | 10.1 ± 4.4 | 7.8 ± 3.3 | 12.8 ± 2.2 | 7.8 ± 1.1 | 15.8 ± 4.0 | 9.7 ± 4.4 | 3.6 ± 0.4 | 4.5 ± 2.2 | 5.1 ± 2.2 | 5.1 ± 2.2 | 8.1 ± 5.6 | 6.8 ± 5.6 | |
| Crawford et al., 201834** | 0.5 | 7.6 ± 1.8 | 5.3 ± 3.0 | ||||||||||
| 1.1 | 14.2 ± 3.4 | 7.2 ± 4.1 | |||||||||||
| Mirelman et al., 201540 | Self Selected | ||||||||||||
| Adult: 1.34 | 5.8 ± 2.0 | 4.4 ± 1.5 | |||||||||||
| Older: 1.24 | |||||||||||||
| Adult fast: 1.69 | 7.5 ± 2.9 | 5.2 ± 1.6 | |||||||||||
| Older fast: 1.61 | |||||||||||||
| Murray et al., 196939 | Self Selected | ||||||||||||
| Adult: 1.5 | 10 ± 1.5 | 8.5 ± 0.2 | |||||||||||
| Older: 1.26 | |||||||||||||
| Adult fast: 2.1 | 16.7 ± 1.2 | 10.7 ± 2.9 | |||||||||||
| Older Fast: 1.7 | |||||||||||||
| Judge et al., 199635 | Self Selected | ||||||||||||
| Adult: 1.16 | 3.0 ± 1.0 | 3.0 ± 1.0 | 9.0 ± 3.0 | 6.0 ± 2.0 | 9.0 ± 4.0 | 7.0 ± 2.0 | 1.0 ± 4.0 | 0.0 ± 4.0 | |||||
| Older: 1.03 | |||||||||||||
| Lee et al., 2005 | Self Selected | ||||||||||||
| Adult: 1.3 ± 0.14 | 11.0 ± 5.0 | ||||||||||||
| Older: 1.2 ± 0.18 | 15.0 ± 5.0 | ||||||||||||
| Adult slow: 0.9 ± 0.15 | 12.0 ± 5.0 | ||||||||||||
| Older slow: 0.9 ± 0.14 | 15.0 ± 4.0 | ||||||||||||
| Adult fast: 1.7 ± 0.24 | 13.0 ± 5.0 | ||||||||||||
| Older fast: 1.6 ± 2.3 | 17.0 ± 5.0 | ||||||||||||
| Lim et al., 201337 | Self-selected | 3.5 ± 2.9 | 9.0 ± 3.7 | 7.7 ± 2.8 | 4.0 ± 3.6 | ||||||||
| Adult: 1.2 ± 2.9 | |||||||||||||
| Older: 1.6 ± 3.7 | |||||||||||||
| Krupenevich et al., 202038*** | Self-selected | 6.8 ± 2.2 | 8.3 ± 1.7 | ||||||||||
| Adult: 1.43 ± 0.1 | |||||||||||||
| Older: 1.42 ± 0.1 | |||||||||||||
SAG, sagital plane; FRONT, frontal plane; TRANS, transverse plane.
Data provided by author. Standard Deviation (SD) estimated from graphs and calculated from SE according to the Cochrane Handbook.
The meta-analysis (n = 207 from 6 studies)30,32,33,35–37 provided low-quality evidence that there are no differences between older adults and adults in pelvic sagittal plane ROM during walking, regardless of walking speed (Slow, SMD [95% CI]: −1.33 [−5.66, 3.00]; Comfortable, SMD: 0.28 [−0.17, 0.73]; Faster, SMD: −0.41, [−0.94, 0.12]) (Fig. 2). In addition, meta-analyses of pelvic obliquity for slow speed walking (n = 110 from 3 studies)12,30,33 provided moderate quality evidence, and for comfortable speed walking (n = 79)12,30,32,33,35 and fast speed walking (n = 136)30,31,33,35 low quality evidence that there is no difference between adults and older adults (Slow, SMD: −1.08 [−2.27, 0.11]; Comfortable, SMD: −0.72 [−1.56, 0.12]); Faster, SMD: −0.85 [−2.01, 0.32]). Finally, six studies (n = 259) reported pelvic rotation data. Meta-analysis showed low-quality evidence that there is no difference in pelvic rotation ROM during slow walking speed between older adults and adults (SMD: −0.04 [−1.07, 0.99]), moderate quality evidence that older adults have smaller pelvic rotation during comfortable speeds (SMD: −0.90 [−1.35, −0.45]) and high-quality evidence that older adults have smaller pelvic rotation during fast walking speed (SMD: −1.55 [−3.43, −0.33]) (Supplementary material online).
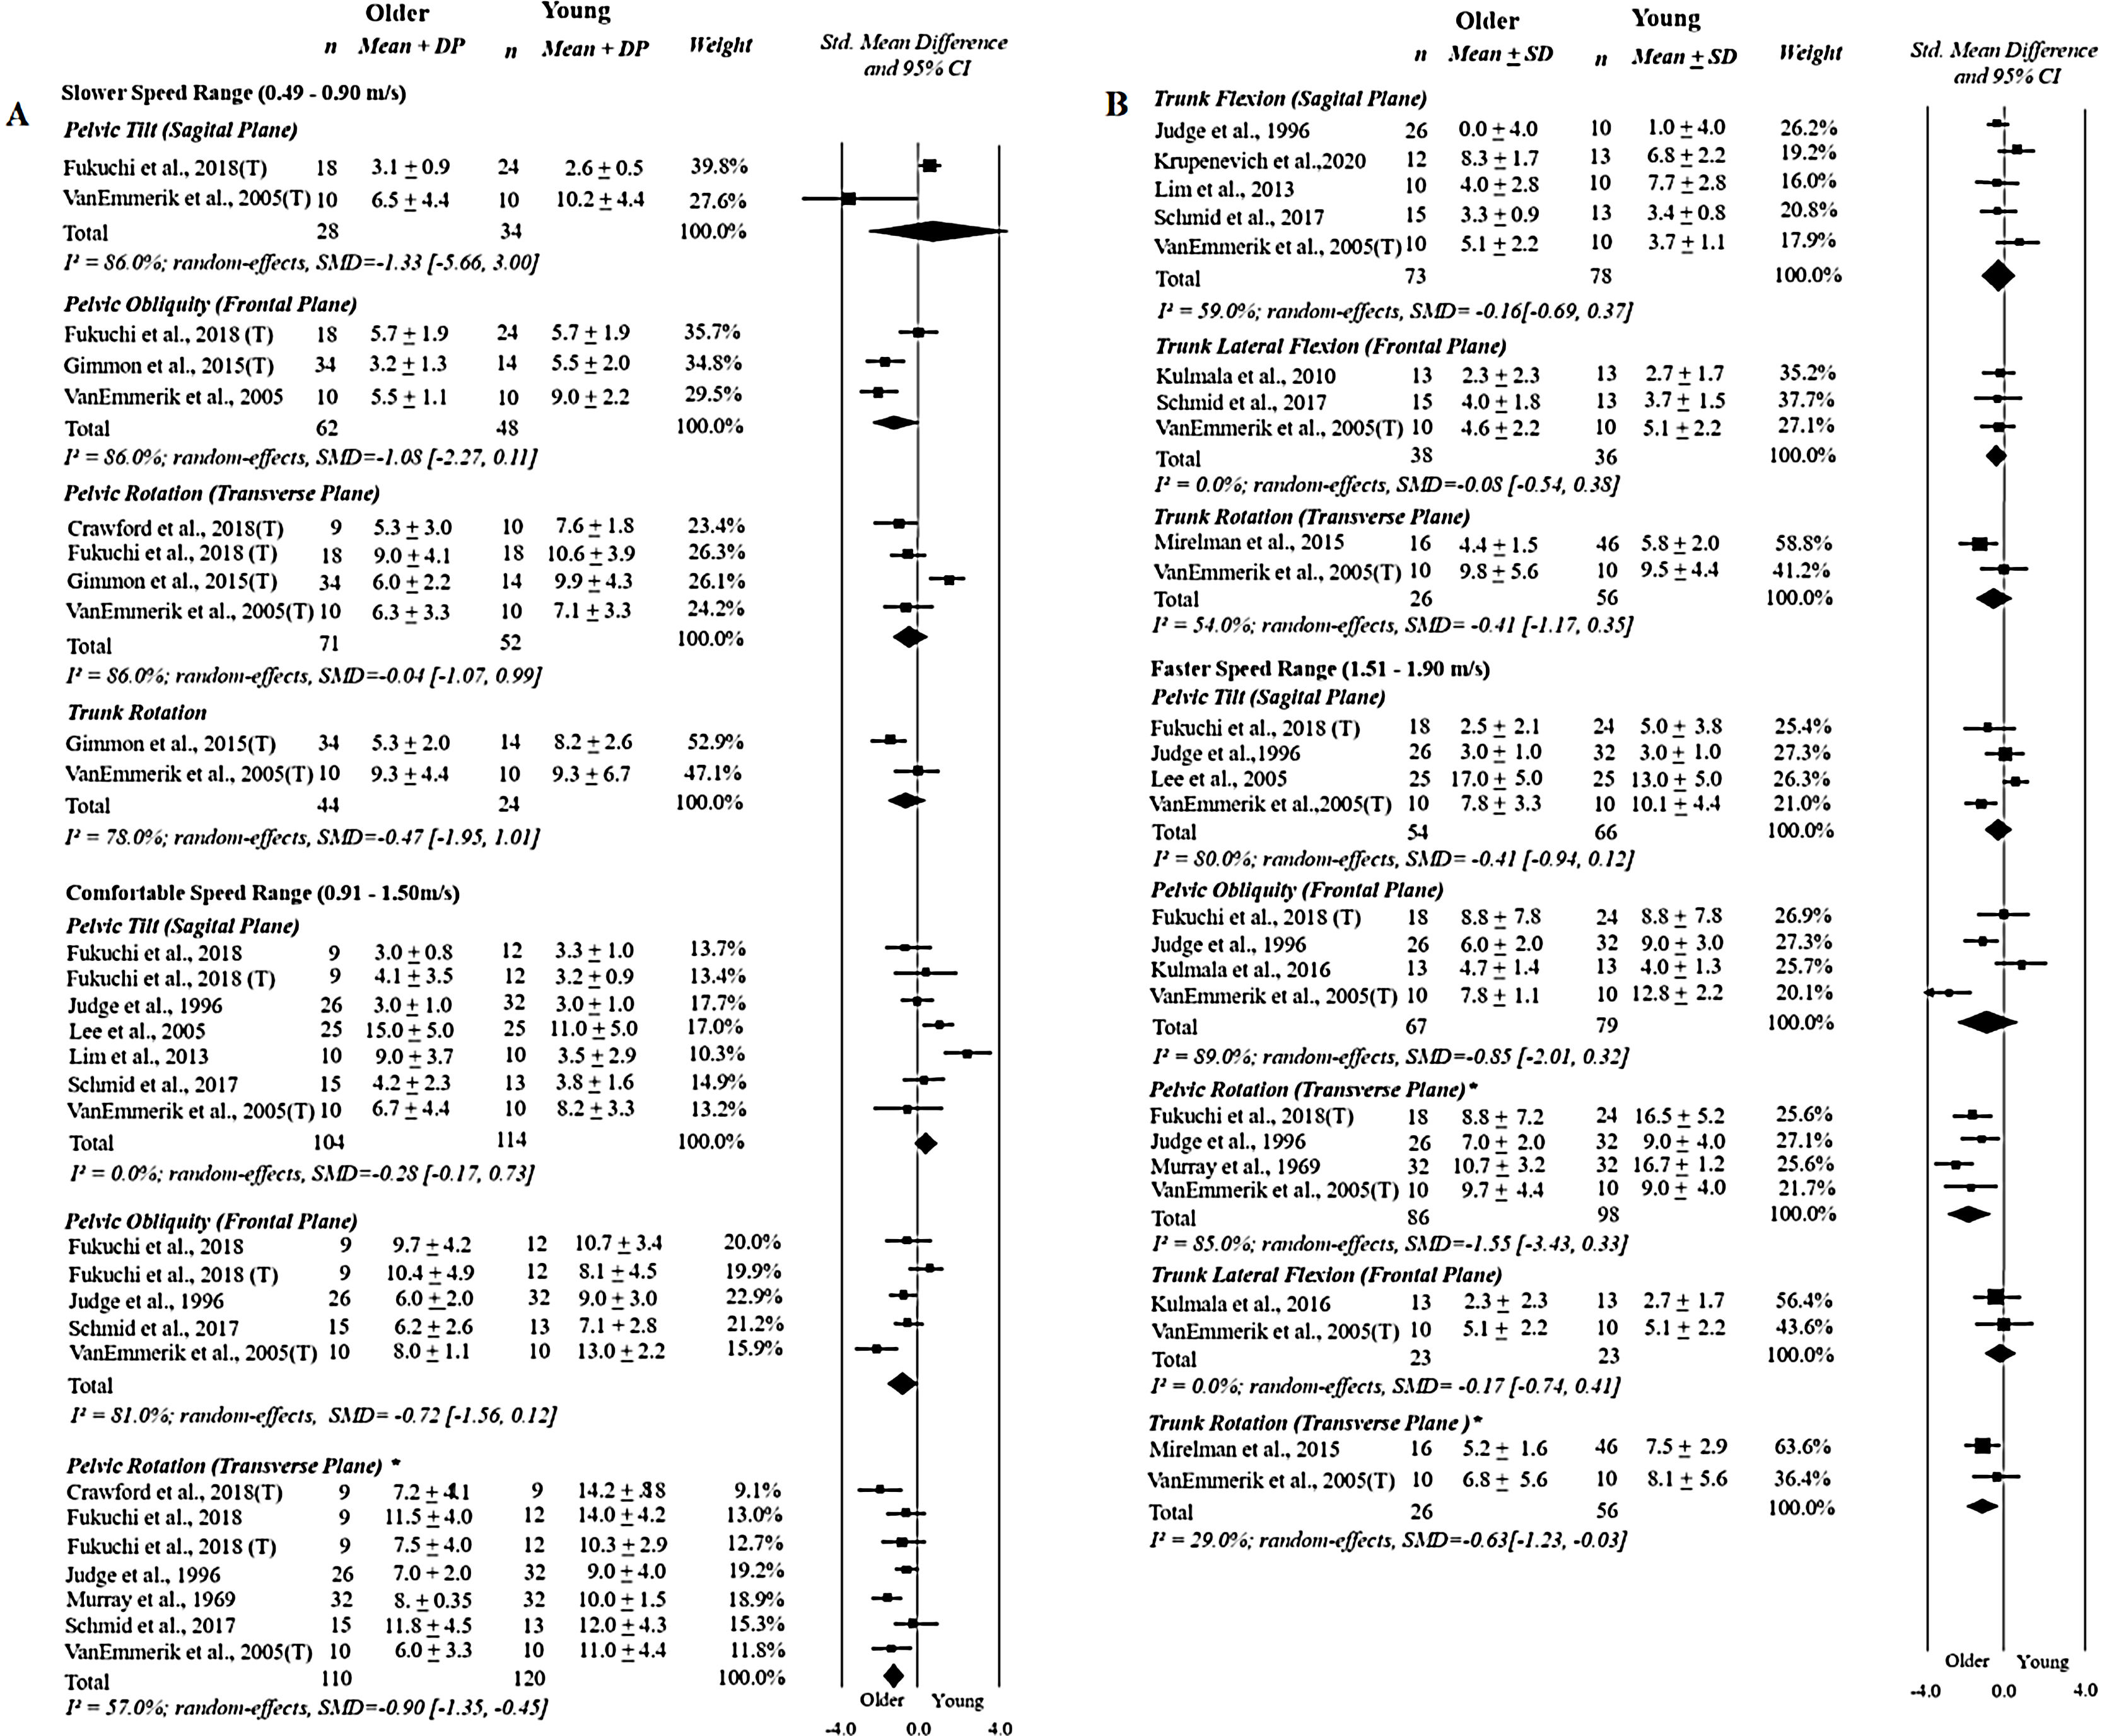
Forest plot displaying the pooled effects of aging on the variables included in the meta-analysis: range of motion of the pelvis (2.A) and the trunk (2.B) in three planes of motion. (*): Statistically significant results. (T): data from treadmill walking. (n): number of participants. (SD): standard deviation. (CI): confidence interval.
Two studies reported trunk rotation data for slow (n = 68),12,33 comfortable (n = 82),33,40 and fast (n = 82)33,40 walking speeds. There is low quality evidence that there are no differences for trunk rotation ROM for slow (SMD: −0.47, [−1.95, 1.01]) and comfortable (SMD: −0.41 [−1.17, 0.35]) walking speeds. In contrast, there is low quality evidence that older adults have smaller trunk rotation ROM during fast walking speed (SMD: −0.63 [−1.23, −0.03]). Five studies32,33,35,37,38 (n = 151) reported data on trunk flexion during comfortable speeds (SMD: −0.16 [−0.69, 0.37]). Three studies31–33 (n = 74) reported data on trunk lateral flexion for comfortable walking speed (SMD: −0.08 [−0.54, 0.38]) and two studies31,33 (n = 46) for fast walking speed (SMD: −0.17 [−0.74, 0.41]). There is low to moderate quality evidence that there are no differences in trunk ROM in the sagittal and frontal planes during comfortable and fast walking speeds. There were an insufficient number of studies to compare trunk ROM in the sagittal and frontal planes during slow walking speed, and trunk ROM in the sagittal plane during fast walking speed.
DiscussionOlder adults have a smaller pelvic rotation ROM at comfortable and fast speed ranges and smaller trunk rotation at fast speed ranges. There were no differences between groups in pelvic tilt and pelvic obliquity ROM for any speed. The overall quality of the evidence was low, except for the pooled data for pelvic rotation which had moderate-quality evidence.
Considering the small number of studies and the high heterogeneity in most of the meta-analyses, further research is likely to change these results. These high heterogeneity levels may be due to the differences in settings of the studies, for example, different instructions to participants or modelling of the segments being measured. Another reason maybe variations in the functional status of participants in the older adults group. Older adults had smaller pelvic ROM in the transverse plane than adults. As shown in Fig. 2, the mean ROM of pelvic rotation during slow walking speed was 6.8˚ for older adults and 9.2˚ for adults; during comfortable walking speed it was 8.8˚ for older adults and 12.2˚ for adults. This difference was greater at fast walking speeds, with the adults showing increased pelvic rotation ROM (14.4˚) in comparison to older adults (8.8˚). We observed a moderate to large effect size of age on pelvic ROM in the transverse plane (slow: −0.75 [−1.23, −0.027]; comfortable: −0.86 [−1.49, −0.22]; fast: −1.45 [−2.33, −0.56]). The reason for smaller pelvic ROM might be multifactorial, since the pelvic segment is the connection between the lower limbs and the upper body. Older adults present important loss of body muscle mass and strength41 and trunk muscle weakness.14,10,41 Spine, hip, and knee extensor weakness is related to poor thoracic and lumbar mobility, especially after the 70th decade of life.15,42 The muscle weakness may help to explain the smaller pelvic rotation during gait. Pelvic rotation loss might be associated with some features of gait typically observed in older adults, like decreased stride length and speed. Pelvic movement in the transverse plane influences step length, especially during faster gait speeds.12,43 Therefore, the smaller pelvic rotation demonstrated by older adults help to explain why older adults have smaller step length and consequently gait speed.35
A previous study demonstrated that older adults have smaller hip extension during late stance phase.1 During late stance, pelvic posterior rotation is coupled with hip extension.43 Moreover, pelvic anterior rotation is dependent of proper ankle push-off, which is also compromised in older adults.1,44 Younger participants increase the pelvic rotation ROM to keep up with imposed speed increments (either by walking on a treadmill or being asked to walk faster), while older subjects are not able to use this movement strategy, despite being able to achieve the same speed levels. They might have to develop different strategies or compensations to be able to achieve faster gait speeds. Future studies could investigate muscle activation patterns along with kinematics research to verify this rationale.
In this review, the lack of differences in trunk movement in sagittal and frontal plane for slow and comfortable speeds may be related to the reduced overall trunk ROM that occurs during comfortable gait speed ranges. Therefore, statistical comparisons might not have been able to identify between-group differences adequately. In addition, adults and older adults’ trunk movement may respond to increases in gait speed differently. According to VanEmmerik et al.,33 adults respond to increases in speed with larger changes in trunk movement in the sagittal plane, while older adults increase transverse plane movement.33 Therefore, the differences between the two groups might only be expected with an imposed increase in speed. In addition, faster speeds increase coordinated rotation between the pelvic and trunk segments in the transverse plane during walking.45 Older adults are less adaptable to changes in walking speed, and might exhibit smaller rotations of the trunk and pelvis to reduce oscillations of the COM and to maintain stability during more challenging gait speeds.12,33
Heterogeneity for trunk data was low to moderate. The small number of studies with small sample size included in each comparison might have compromised the power of the meta-analysis. Another source of heterogeneity is how the trunk segment was defined as the use of different trunk models result in different magnitudes of trunk motion.44,46,47 Trunk ROM is also influenced by gait speed variations.30,33,48 The range of faster speeds (1.51–1.90 m/s) implemented by the included studies was probably not sufficiently challenging to increase trunk motion and consequently elicit differences between groups. Future studies should include more challenging gait speeds to properly investigate trunk movement differences in older adults.
According to the GRADE system, pooling of studies that compared pelvic movement during walking between adults and older adults varied from low to moderate quality evidence. The major sources of bias that may compromise the generalizability of the findings49 were related to lack of reporting of sample characteristics that could assert their comparability, i.e. gait functional status for the older adults group31–37 and use of non-representative samples.12,30–40 Other concerns arise from poor experimental protocol consistency (e.g. not using standardized instruction to participants and assessor’s training,) and omission of sample size calculations. In addition, all of the included studies only reported average ROM data for the entire gait cycle. Therefore, it is not possible to affirm if there are differences in pelvic motion during specific gait phases, such as single limb support or toe-off, for instance. Future studies could feature specific phases during the gait cycle50 and should follow recommendations from the international society of biomechanics to reduce variability in the implemented methods and in the reporting of the results.51
The relatively low mean age of the older adults participants is a limitation of the included studies. Therefore, differences in pelvic and trunk ROM of older adults might have been masked by the inclusion of adults younger than 60 years of age. Alterations in gait are more pronounced in individuals older than 70 years of age.17,52–56 While an older age cut-off would be desirable, it is also interesting to investigate kinematic changes that occur in middle-aged individuals. Another limitation is that the analysis included both men and women in the same group. Whitcome et al.57 showed that mean pelvic rotation was greater in females at slow and faster speeds. Because the studies included men and women in the same groups, it was not possible to make a gender analysis. Finally, the inclusion of studies using treadmill and overground walking in the meta-analysis is another possible limitation, as pelvic movement is affected by treadmill walking.58 Walking on the treadmill significantly decreases pelvic ROM in the transverse plane and, to a lesser extent, anterior tilt.59 This could mask the effects of age on pelvic motion reported in this review.
ConclusionsOur findings showed that older adults walk with less pelvic rotation ROM at comfortable and fast walking speeds, and less trunk rotation ROM during fast walking speed. The quality of evidence varied from low to high. Future research would benefit from consensus on experimental setup and trunk segment definition to provide comparisons that are more homogeneous. It is also advised to calculate sample sizes and try to make samples as representative as possible. Other suggestions might be to include older age groups (>75) based on justified age limits and to assess participants' functional status with validated tools, to help comparison and generalization of the findings.
Conflict of interestThere are no known conflicts of interest associated with this publication.
This study was financed in part by the Coordenação de Aperfeiçoamento de Pessoal de Nível Superior - Brasil (CAPES) - Finance Code 001. We are also thankful to the Fundação de Amparo à Pesquisa do Estado de Minas Gerais (FAPEMIG) [grant number APQ-01017-17] and to the Conselho Nacional de Desenvolvimento Científico e Tecnológico (CNPQ) [grant number 428735/2018-5].
The following is Supplementary data to this article:


