
To evaluate the agreement between the measured peak oxygen uptake (VO2peak) and the VO2peak estimated by four prediction equations based on the six-minute walk test (6MWT) in chronic heart failure patients.
MethodThirty-six chronic heart failure patients underwent cardiopulmonary exercise testing and the 6MWT to assess their VO2peak. Four previously published equations that include the variable six-minute walk distance were used to estimate the VO2peak: Cahalin, 1996a (1); Cahalin, 1996b (2); Ross, 2010 (3); and Adedoyin, 2010 (4). The agreement between the VO2peak in the cardiopulmonary exercise testing and the estimated values was assessed using the Bland–Altman method. A p-value of <0.05 was considered statistically significant.
ResultsAll estimated VO2peak values presented moderate correlation (ranging from 0.55 to 0.70; p<0.001) with measured VO2peak values. Equations 2, 3, and 4 underestimated the VO2peak by 30%, 15.2%, and 51.2%, respectively, showing significant differences from the actual VO2peak measured in the cardiopulmonary exercise testing (p<0.0001 for all), and the limits of agreement were elevated. The VO2peak estimated by equation 1 was similar to that measured by the cardiopulmonary exercise testing, and despite the agreement, bias increased as VO2peak increased.
ConclusionsOnly equation 1 showed estimated VO2peak similar to the measured VO2peak; however, a large limits of agreement range (∼3 METs) does not allow its use to estimate maximal VO2peak.
Peak oxygen uptake (VO2peak) is an important measurement of maximal functional capacity in patients with chronic heart failure (CHF). It is also a predictor of survival and an indicator for heart transplantation in these patients.1–3 Although cardiopulmonary exercise testing (CPET) is considered the ideal process to evaluate oxygen consumption in subjects with CHF,4 the high cost of the technique may limit access to it.
The six-minute walk test (6MWT) has been used as an alternative to the CPET to evaluate functional capacity in these individuals due to its feasibility and lower cost.5,6 Prediction equations have been suggested to estimate VO2peak in subjects with CHF7–9 based on the six-minute walking distance (6MWD). These equations have demonstrated good correlation with anthropometric characteristics,7,8 cardiac and lung function at rest,7 6MWD,7–9 and VO2peak, but the determination coefficient varies widely. In addition, the standard error of the estimate (SEE) reaches values close to 1 MET, which may represent a large percentage of the maximal functional capacity of patients with CHF. These results have led us to hypothesize that the VO2peak estimated from the 6MWT does not indicate the real VO2peak of these patients. Furthermore, no studies evaluated the agreement between measured and estimated VO2peak values in a sample of individuals with CHF. The evaluation of agreement between two measurements allows for quantifying the differences between these measures and establishing limits of agreement and bias.10
Therefore, the present study aims to evaluate the agreement between the measured VO2peak and the VO2peak estimated by four prediction equations based on the 6MWD in subjects with CHF.
MethodThe inclusion criteria were established to obtain a homogeneous sample of CHF patients that included patients clinically diagnosed with CHF (left ventricular ejection fraction <50%). Those who were stable for at least two months in optimal pharmacological treatment, aged between 25 and 59 years, with a body mass index <30kg/m2 and not practicing regular exercise were included in the study. Older adults, adolescents, or obese patients and those practicing regular exercise (because it affects disease severity and control) were not included in order to avoid other mechanisms potentially being involved in the pathophysiology of the disease. Patients were excluded if: they were classified as class IV according to the New York Heart Association (NYHA IV), with limiting disorders to physical exercise, recent history of pulmonary disease, unstable angina, uncontrolled arrhythmias or peripheral arterial disease, or if they did not reach a respiratory exchange ratio (RER) greater than or equal to 1.0 during CPET.11Table 1 shows the main characteristics of the samples in the different studies.
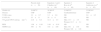
Comparisons between the samples of the studies that proposed equations 1–4.
| Present study (n=36) | Equations 1 and 2 Cahalin et al.7 (n=40) | Equation 3 Ross et al.9 (n=48) | Equation 4 Adedoyin et al.8 (n=65) | |
|---|---|---|---|---|
| Gender (n) | 29 M/7 F | 36 M/4 F | 23 M/25 F | 35 M/30 F |
| Disease | CHF | CHF | Cardiopulmonary | CHF |
| NYHA class | 2.2±0.7 | 3.3±0.6 | NR | 2.6±0.5 |
| LVEF (%) | 35±11 | 20±6 | NR | NR |
| VO2peak CPET (mL/kgmin−1) | 21.8±6.8 | 12.4±4.5 | Men: 13.7±3.5 Women: 12.5±3.1 | NR |
| RER | 1.08±0.16 | 1.09±0.18 | NR | NR |
| 6MWD (m) | 589±91 | 310±100 | Men: 361±136 Women: 346±128 | NR |
Equation 1: VO2peak=0.03×distance (m)+3.98; equation 2: VO2peak=0.02×distance (m)−0.191×age (years)−0.07×weight (kg)+0.09×height (cm)+0.26×RPP (×l0−3)+2.45; equation 3: VO2peak=4.948+0.023×distance (m); equation 4: VO2peak=0.0105×distance (m)+0.0238×age (years)−0.03085×weight (kg)+5.598. CHF, chronic heart failure; CPET, cardiopulmonary exercise testing; LVEF, left ventricular ejection fraction; NR, not reported; 6MWD, six-minute walking distance; cm, centimeters; kg, kilograms; m, meters; RER, respiratory exchange ratio; RPP, rate-pressure product; VO2peak, peak oxygen uptake.
This study was approved by the ethics committee of the institution (protocol number 050/09, Comitê de Ética em Pesquisa, Universidade Federal de Minas Gerais (UFMG), Belo Horizonte, MG, Brazil) in which the research was conducted in accordance with the Declaration of the World Medical Association. Volunteers signed a written informed consent form before participation.
Outcome measuresCardiopulmonary exercise testingSubjects underwent a CPET under medical supervision for assessing VO2peak, using the gas analyzer (CPX Ultima Medical Graphics®, USA) and the breath-by-breath method. The ramp test protocol was performed on an electronic treadmill, as described by Pereira et al.12 The oxygen saturation and electrocardiogram were continuously monitored, and blood pressure was checked every 2min. Perceived exertion was measured on a Borg scale from 0 to 10.13 The volunteers were instructed to maintain their usual medication, to refrain from cigarettes, food or drinks with caffeine for a period of 3h, and to avoid exercise in the 12h preceding the test.14,15 The VO2peak was defined as the highest 10-second average value obtained during the last 30s of the CPET.16
Six-minute walk testThe 6MWT was carried out with a time interval of about one week after the CPET, in accordance with the standards of the American Thoracic Society.17 Each patient was instructed to walk as quickly as possible without running in a 30-meter long corridor for 6min. Two 6MWTs were performed with intervals of 30min between them. If the difference between them exceeded 10%, a third test was applied. The test with the higher 6MWD was selected for analysis. Heart rate and oxygen saturation were continuously monitored during the test.
Estimation of peak oxygen uptakeFour previously published equations,7–9 which included the variable 6MWD, were used in this study (Table 1): equation 1 (VO2peak=0.03×distance in meters+3.98),7 equation 2 (VO2peak=0.02×distance in meters−0.191×age in years−0.07×weight in kg+0.09×height in cm+0.26×RPP×l0−3+2.45),7 equation 3 (VO2peak=4.948+0.023×distance in meters)9 and equation 4 (VO2peak=0.0105×distance in meters+0.0238×age in years−0.03085×weight in kg+5.598).8 A weight scale with an attached stadiometer was used to measure the anthropometric data (Filizola™, Brazil).
Data analysisContinuous variables were presented as mean±standard deviation and the categorical variables as frequency values. The presence of normal distribution of the data was assessed using the Shapiro–Wilk test. The agreement between the VO2peak measured in the CPET and the values estimated by the four equations was analyzed using the Bland–Altman method, which consists of a statistical and graphical approach for comparing two measurements of clinical variables. Using this method, it is possible to calculate the bias (difference between the measurements obtained by both methods), the mean and standard deviation of these differences, and the upper and lower limits of agreement (LoA) obtained per equation: bias±1.96 SD. The analysis is made by visually examining the graph, observing the data dispersion between the upper and lower LoA and their proximity to zero.10 In addition, one sample T-test was used to check if the bias was statistically different from zero. According to Bland and Altman,10 there is no agreement between the measurements when the bias is statistically different from zero and/or when the limits of agreement are very wide. We also performed Pearson's correlation analysis to verify the association between the measured and estimated VO2peak. One-way analysis of variance (one-way ANOVA) was used to compare the values of VO2peak among NYHA classes and repeated measures ANOVA was used to compare the VO2peak values obtained in the CPET with the values estimated by the four equations. The Bonferroni test was used as the post hoc analysis. An alpha level of 5% was considered to establish significance. Statistical analysis was performed using the Statistical Package for the Social Sciences, version 17 (SPSS Inc., Chicago, IL, USA).
ResultsTable 1 shows the comparisons among the samples of the studies that developed equations 1–4. The respiratory exchange ratio (RER) was similar to equations 1 and 2. The cardiac function (LVEF) and the maximal functional capacity of the patients were higher than equations 1–3. The study of equation 4 did not report these values.
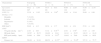
The physical and clinical characteristics of the 36 subjects with CHF assessed in this study are shown in Table 2. This sample consisted primarily of male subjects (29 men). About 17% were in NYHA functional class I (n=6), 47% in NYHA class II (n=17), and 36% in NYHA class III (n=13). The VO2peak achieved in the CPET and the 6MWD were statistically different among the NYHA functional classes (p<0.0001 and p=0.002, respectively).
Physical and clinical characteristics of chronic heart failure subjects.
| Characteristics | Total group (n=36) | NYHA I (n=6) | NYHA II (n=17) | NYHA III (n=13) |
|---|---|---|---|---|
| Age (years) | 49.22±11.99 | 54.33±6.83 | 46.00±12.65 | 51.08±12.44 |
| Men/women (n) | 29/7 | 6/0 | 13/4 | 10/3 |
| LVEF (%) | 35.39±11.05 | 45.50±3.94# | 36.65±12.44 | 29.08±6.86 |
| Etiology, n (%) | ||||
| Idiopathic | 7 (19.4%) | |||
| Ischemic | 17 (47.2%) | |||
| Hypertensive | 5 (14%) | |||
| Others | 7 (19.4%) | |||
| BMI (kg/m2) | 26.46±4.13 | 26.54±2.77 | 26.01±4.24 | 27.01±4.68 |
| CPET | ||||
| VO2peak (mL/kgmin−1) | 21.83±6.83 | 31.42±6.39*,# | 23.01±3.78# | 15.85±3.65 |
| HR peak (bpm) | 145.67±26.72 | 164.00±16.41 | 143.41±29.55 | 140.15±24.43 |
| RPP peak (mmHgbpm) | 20,699±8264 | 28,328±5157# | 19,616±7646 | 18,596±8639 |
| 6MWT | ||||
| Distance (m) | 589.89±91.04 | 660.50±81.53# | 612.82±78.34# | 527.31±75.77 |
Data presented as mean±standard deviation or percentage. BMI, body mass index; CPET, cardiopulmonary exercise testing; HRmax, maximum heart rate; LVEF, left ventricular ejection fraction; RPP peak, rate-pressure product; 6MWT, six-minute walking test; VO2peak, peak oxygen uptake.
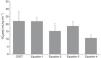
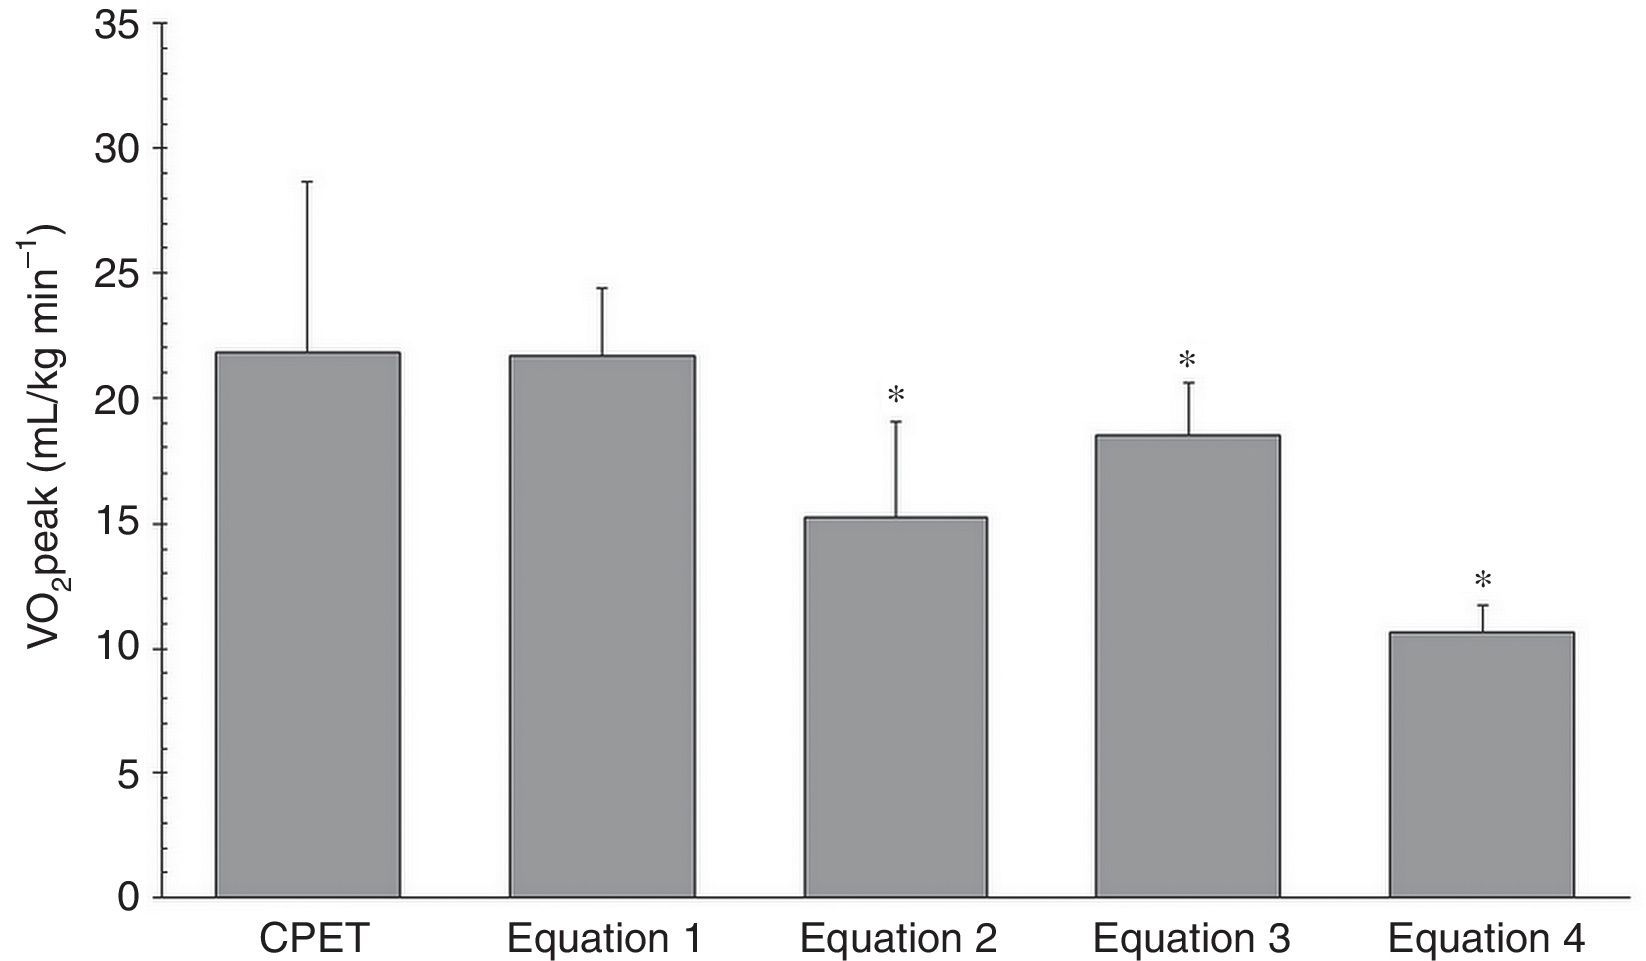
Fig. 1 shows significant differences between three of the four prediction equations (equations 2–4) and the VO2peak values measured in the CPET (p<0.0001). Although all equations presented moderate levels of correlation with the measured VO2peak (r>0.5; p<0.001), equations 2–4 underestimated the results by 15–51% (Table 3). Equation 1 presented the highest correlation with the measured VO2peak (r=0.70; p<0.0001).
Percentage of VO2peak underestimation and correlations between VO2peak and direct measurement.
| Prediction equation | VO2peaka (mL/kgmin−1) | Underestimation of CPET VO2peak (%) | Correlation with CPET VO2peak (r; p value) |
|---|---|---|---|
| CPET VO2peak | 21.83±6.83 | – | – |
| Equation 1 (Cahalin 1) | 21.68±2.73 | 0.7% | 0.70; <0.0001 |
| Equation 2 (Cahalin 2) | 15.29±3.74 | 30.0% | 0.55; 0.001 |
| Equation 3 (Ross) | 18.52±2.09 | 15.2% | 0.70; <0.0001 |
| Equation 4 (Adedoyin) | 10.66±1.07 | 51.2% | 0.60; <0.0001 |
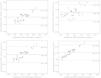
The Bland–Altman analysis did not reveal agreement among the VO2peak values in the CPET and those estimated by equations 2–4 because the difference between the measurements obtained by both methods showed a bias that was statistically different from zero (p=0.007) and very large limits of agreement (Fig. 2). Furthermore, the linear relationship between the mean and the difference of the measurements indicates improved NYHA class and consequently improved maximal functional capacity. There is also an increase in the VO2peak prediction error.
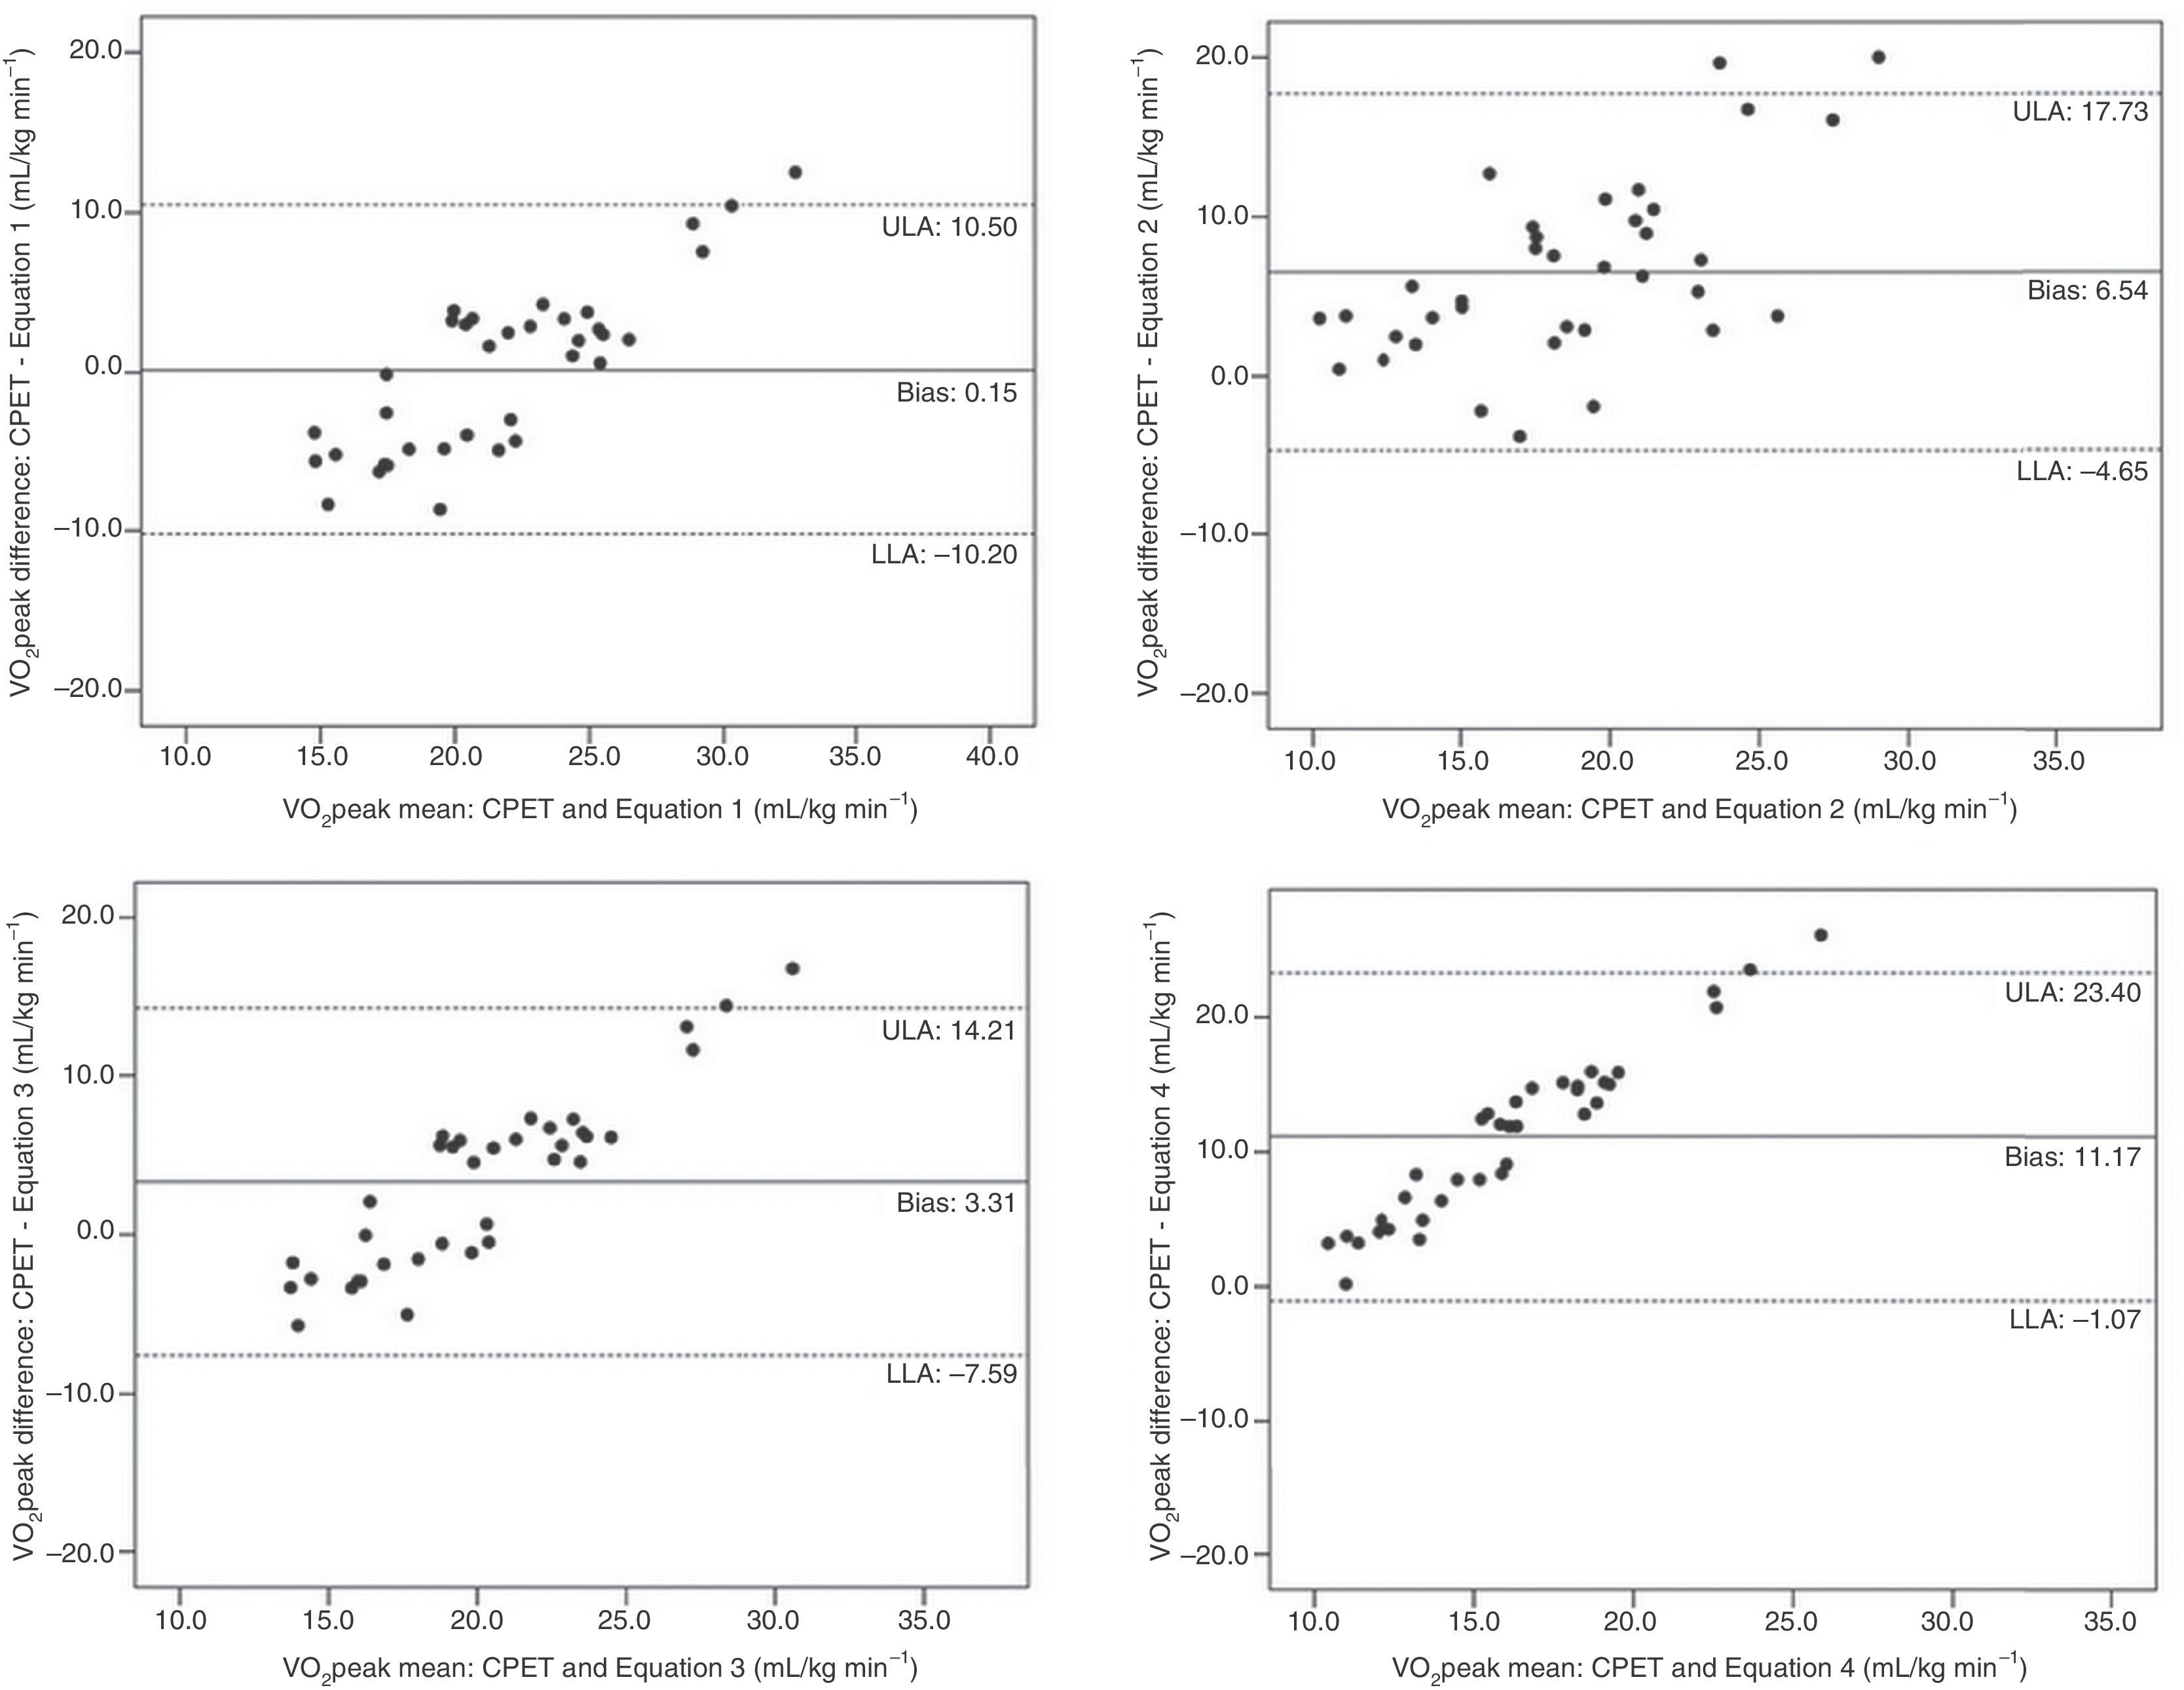
In equation 1, the comparison between the measured and the estimated VO2peak in the CPET was not statistically different (21.83±6.83 vs 21.68±2.73; p=0.867) (Fig. 1). Further, the bias was close to zero. However, a large data scatter was observed between the upper and lower limits of agreement, and there was also a linear relationship between the difference and the mean measurements (r=0.82; p<0.0001). In other words, despite the observed agreement, the bias was not constant and increased with the increase in VO2peak (Fig. 2).
DiscussionThis study showed that only in equation 1 was the estimated VO2peak similar to the direct VO2peak measured in the CPET in subjects with CHF. In addition, a lack of agreement was observed between the direct VO2peak and the estimated VO2peak in prediction equations 2–4, considering that to be consistent, the average difference between the measured and the estimated value (bias) should be close to zero and the LoA range (upper and lower limits of agreement) should be close to each other.
According to the Bland–Altman analysis, in equation 1 the mean differences (bias) between measured and estimated VO2peak were close to zero; however, the upper and lower LoA were elevated. This situation demonstrates that bias increases linearly with VO2peak improvement, and the large LoA range (∼3 MET) prevents estimation of maximal VO2peak. In equations 2–4, the correlation analyses showed associations of moderate magnitude despite the lack of agreement between the estimated and measured VO2peak. In this sense, it is necessary to use methods that establish the LoA to evaluate the agreement between two measures and the confidence intervals acceptable of clinical point of view, while the correlations only indicate the association between the variables, e.g., measured VO2peak and the VO2peak estimated by equations.
In all equations, the bias increased linearly with increasing VO2peak, indicating that the increase in NYHA class reduces the VO2peak prediction error. This finding may be due to reduced functional capacity of NYHA III patients, as their energy expenditure in the 6MWT was maximal or close to maximal.18 Moreover, the worst agreement was observed in NYHA I patients, probably because the 6MWT could be submaximal for the majority of the patients in this functional class. This could suggest that the equations might be good for predicting VO2peak from 6MWT in specific subgroups of the disease, i.e., the ones with lower maximal functional capacity.
The wide variability in the VO2peak estimated by the equations could be explained by the different methodologies used in the studies and the different variables used in the equations. Equations 2 and 4 were the ones that underestimated VO2peak the most (by 30% and 51.2%, respectively). In both equations, anthropometric variables, such as weight and height, were included. As these variables relate both to the distance covered and VO2peak, it is possible to include them in the equations, and although it increases the determination coefficient (R2), the estimate error19 can also increase. The samples that originated equations 1, 2, and 4 have clinical and anthropometric characteristics similar to our study sample, including young and middle-aged adults belonging to NYHA classes I–III.7,8 Only equation 3 was developed in patients with cardiopulmonary disease9 and not specifically CHF. None of the above equations were developed with NYHA IV patients. Left ventricular ejection fraction, direct VO2peak (CPET), and 6MWD were higher in the present study compared to the studies of equations 1–3. The equation 4 study did not report these values. The lack of agreement between the measured and the estimated VO2peak may have been influenced by the better functional capacity of our patients, but this result may also reflect the inability of indirect methods to predict the VO2peak of patients with CHF, which had already been observed in CHF patients in the literature.2,4,18
In patients with CHF, the assessment of maximal functional capacity also aims at risk stratification, prognostic evaluation, and indication for heart transplantation.1,2 Thus, the direct measurement of VO2peak by CPET is the gold standard for this purpose.3,4 On the other hand, the 6MWT has emerged as a viable and reproducible option of submaximal evaluation.20 Some studies6,21–24 have demonstrated its clinical utility in detecting the functional capacity of CHF subjects. Moreover, clinical applicability to 6MWT is available, technically feasible, low cost, and an indicator for activities of daily living (ADL).18,25 In this way, the 6MWT can be helpful for submaximal assessment because it represents ADL, but it is not appropriate to predict maximal functional capacity as expressed by VO2peak,18 because it has not proved accurate for predicting VO2peak.
The present study does have some limitations. First, a methodological limitation is the absence of patients classified as NYHA IV because they are the ones who would benefit the most from an evaluation such as the 6MWT. However, they are very critical, clinically unstable patients, with frequent decompensation and difficult therapeutic optimization. Thus, these individuals are very difficult to be sampled. Second, the relatively small sample size could be a limiting factor for the Bland–Altman analysis. In addition, it does not allow separate analyses of the NYHA classes or the formulation of a reference VO2peak equation from the 6MWT for this population.26 Equation 1 seems to be able to predict VO2peak in patients with lower maximal functional capacity. Future studies will be necessary to clarify these aspects.
ConclusionAlthough all VO2peak values estimated by equations presented a moderate association with the VO2peak measured in the CPET, only equation 1 presented similar results. However, even for this equation, the VO2peak estimated by the 6MWD in the CHF patients was not a valid measure for predicting the maximal exercise capacity of this population because these values were not consistent with the gold standard method of CPET. This study emphasizes the need for validation of the proposed equations in specific populations.
Conflicts of interestThe authors declare no conflicts of interest.
This research was supported by Conselho Nacional de Desenvolvimento Científico e Tecnológico (CNPq), Brazil (Process #307597/2011-3), Fundação de Amparo à Pesquisa do Estado de Minas Gerais (FAPEMIG), Brazil (PPM 00377-13), and Coordenação de Aperfeiçoamento de Pessoal de Nível Superior (CAPES), Brazil.