

Hypertension (HT) contributes substantially to poor physical function, cognitive dysfunction, cardiovascular problems and to all-cause mortality. Performance in activities requiring attention, speed and coordination might also be affected in individuals with HT.
ObjectiveThis study compared the processing speed, static and dynamic balance, functional mobility and fear of falling between individuals with hypertension (HT group) and normotensive individuals (NT group).
MethodsOne-hundred and twenty-eight individuals were included: NT group (n = 64) and HT group (n = 64). The Choice Stepping Reaction Time Test was used for the evaluation of processing speed, Single Leg Stance test for static balance evaluation, “Y” Balance Test for dynamic balance evaluation, Timed Up and Go test with single and dual tasking for the evaluation of functional mobility and Falls Efficacy Scale for assessing fear of falling.
ResultsThe processing speed of the HT group was slower than that of the NT group; the total response time (RsT) in Stepping Reaction Test (SRT) (mean difference [MD] = −0.2, 95% CI = −0.3, 0), and Stroop Test (ST) [ST-A (MD = −0.4, 95% CI = −0.5, −0.2), ST-B (MD = −0.5, 95% CI = −0.7, −0.2) and ST-C (MD = −0.6, 95% CI = −0.8, −0.3). Additionally, the static [single leg stance, eyes open, right side (MD = 12.7, 95% CI = 6.3, 19.0) and left side (MD = 13.6, 95% CI = 7.2, 19.9)] and dynamic balance [Y balance test, composite score, right lower extremity (MD = 8.5, 95% CI = 4.4, 12.5) and left lower extremity (MD = 5.2, 95% CI = 1.5, 8.8) scores of the HT group were lower than those of the NT group. The HT group required a longer time to complete the functional mobility test measured with Timed Up And Go Test during both single task (MD = −0.8, 95% CI = −1.1, −0.4), cognitive dual task (MD = −1.5, 95% CI = −2.4, −0.5) and manual dual task (MD = −0.9, 95% CI = −1.3, −0.4) in comparison to the NT group. Also, the HT group had higher levels of fear of falling (MD = −7.6, 95% CI = −10.9, −4.2).
ConclusionHypertensive individuals present slower processing speed, reduced static and dynamic balance, decreased functional mobility and higher fear of falling in comparison to normotensive individuals.
Hypertension (HT) is the third ranked factor for disability-adjusted life years.1–3 The prevalence of HT is expected to increase considerably in the upcoming years, therefore it is a significant public health concern in the world.4–6 HT contributes substantially to poor physical function, cognitive dysfunction, cardiovascular problems and to all-cause mortality.7 Derangement in the auto-regulatory system due to hypertension causes cerebral hypoperfusion which has harmful effects on neurocognitive functions.8 Episodic or sustained hypotension and excessive treatment of hypertension may cause cerebral hypoperfusion leading to compromised neuronal function and a neurodegenerative process.9,10 Hypertension-related silent ischemic white matter increases with elevated blood pressure (BP) may cause impairments of attention, perceptual processing and executive functions.11,12 Performance in activities requiring attention, speed and coordination might also be affected in individuals with HT in comparison to normotensive (NT) individuals. Studies investigating psychomotor responses in individuals with HT presented contradictory results, while some studies reported that HT individuals have a slower processing speed in comparison to NT,13–17 others indicated no difference.18,19
While it was shown that HT is a risk factor for cognitive decline and dementia20,21 the existing literature on the association between HT and physical functions are scarce. Vascular brain abnormalities, measured as white matter hyperintensities, have been hypothesized as potential explanatory factors of the association between hypertension and physical function due to perturbations of neural networks.22 Vascular-system-related damage to the musculoskeletal and peripheral nervous systems has been suggested as an alternative cause of poorer physical performance associated with HT.23 Supporting the notion of a contribution of vascular risk factors to motor dysfunction, HT was found to be associated with decrease in walking speed, even for those who control their BP or develop HT later in life.22,23 The study by Hausdorff et al.24 found reduced performance on balance and gait tests in older adults with systemic HT in comparison to age-matched controls.24 It was also found that high blood pressure levels and antihypertensive medication use cause increase body sway which may lead to a risk of falls in this population.25 Although studies investigating processing speed showed conflicting results, the possibility of prolonged processing speed along with reduced balance and mobility functions may increase fall risk in individuals with HT. Eventually reduced mobility level, decreased dynamic balance, fall risk and history of falls may lead to fear of falling.26 Therefore, the aim of our study was to compare processing speed, static and dynamic balance, functional mobility and fear of falling of individuals who were diagnosed with HT and NT individuals. We hypothesized that individuals diagnosed with HT would exhibit slower processing speed, reduced balance, decreased functional mobility and higher fear of falling compared to NT individuals.
MethodsIndividualsThe sample size was calculated by using G* Power 3.0. Statistical power analysis calculations suggested 54 individuals for each group (d = 0.5, α = 0.05, β = 0.20). Considering dropouts, the number was increased by 20%, and finally, 64 individuals were planned to be included. A total of 128 individuals, 64 of whom were diagnosed with HT (HT group) and 64 normotensive individuals (NT group) with similar demographic characteristics. Equal number of men and women participants was recruited in the study in order to eliminate sex differences. Participants aged between 50–65 years of age were included in both groups. Additionally, participants being diagnosed with HT (all stages) [defined as SBP (systolic BP) ≥130 mmHg and/or DBP (diastolic BP) ≥90 mmHg] by a HT specialist based on international recommendations27 were included in the HT group. Whereas participants having normal BP (SBP <120–90 mmHg and DBP <80–60 mmHg) were included in the NT group.27 In order to reduce the possible negative effects of cognitive factors on the outcome measures like processing speed, individuals were excluded if they had cognitive problems (Standardized Mini Mental Test—SMMT ≤ 23). The participants with Body Mass Index (BMI) ≥30 kg/m2 were excluded in order to eliminate the effects of body composition on reaction time and speed of movement. Individuals were also excluded if they had neurological diseases, psychiatric problems, serious orthopedic problems, visual problems, vestibular problems, diabetes with peripheral neuropathy and orthostatic hypotension, and if using four or more medications.
Study designThis comparative cross-sectional study was designed to compare two groups: the HT group which involved the participants who were diagnosed with HT and the NT group which involved the normotensive healthy partners/relatives of the HT group who have similar demographic characteristics. This study was conducted in accordance with the ethical principles of the Declaration of Helsinki and was approved by Board of Scientific Research and Publications of Eastern Mediterranean University, Famagusta, Turkish Republic of Northern Cyprus (TRNC), (2017/39-11). Written informed consents were obtained from the volunteers prior to participation.
Outcome measuresDemographic characteristics [age, sex, height, body weight, body mass index and leg dominance (determined according to the subjective information of the participants by asking them ‘If you would shoot a ball on a target, which leg would you use?’), subjective falling frequency, cognitive level, BP measurement, Choice Stepping Reaction Time Test, Single Leg Stance Test, Y Balance Test, Timed Up and Go Test under single and dual tasking conditions and Falls Efficacy Scale were applied to both the HT and NT groups. All evaluations were performed in a single testing session and performed by the same researcher.
Blood pressure measurementThe BP measurement protocol was based on three sequential measurements by using a sphygmomanometer, 1 min apart between measurements, with the individuals in a sitting position. The first BP measurement was performed after 30 min of resting in a sitting position. The same cuff-based device was used for measuring the blood pressure of all the participants and the device was calibrated before the study.
Processing speed assessmentThe primary outcome of this study was the processing speed which was evaluated by using a computer unit and a custom-made Choice Stepping Reaction Time step pad (CSRT-MAT) (Figure 1A) that was introduced and validated by Schoene et al.28,29 against laboratory-based measurement of CSRT Test. The CSRT-MAT and a display monitor were connected to a computer unit consisted of pressure sensitive panels which represented stepping direction (arrows, stars), program control (‘‘A’’ and ‘‘B’’) as well as two central stance panels (blue foot). The computer unit recorded timing of foot lift and landing at each panel. During measurement of CSRT, participants were asked to stand on the 2-stance panels. The organization of the CSRT-MAT panels was presented on the display screen. In the rest state, each screen panel showed a blue-outlined figure corresponding to a step panel on the CSRT-MAT. A trial consisted of a randomly selected arrow changing its color from white to green on the screen. Participants then were required to step onto the corresponding CSRT-MAT panel as quickly as possible. Participants were informed that stimulus presentation would be random and they should not try to anticipate the location of stimuli. Time between trials also was randomized, with stimuli occurring 1 and 2 s after the participant returned both feet to the central stance panels (Fig. 1B). The CSRT device included 2 tests: Stepping Reaction Time (SRT) and Stroop Test (ST). In the SRT test, the participants were asked to step as quickly as possible onto the corresponding arrow on the CSRT-MAT and then return to the center. In ST, there were 3 separate subtests: Stroop Test A (ST-A), B (ST-B) and C (ST-C). In the ST-A, the participants were asked to step on the arrow pointing to any direction that appears on the screen. In the ST-B, there was an arrow appearing on the screen and a text indicating the opposite direction of that arrow, the participants were asked to take a step in the direction of the text and not in the direction of the arrow. In the ST-C, on the contrary, the participants were asked to take a step in the direction of the arrow and not in the direction of the text. The test consisted of 4 practice trials and 32 test trials.28 The reaction time (RT) measured from stimulus occurrence to movement initiation (lift off), movement time (MT) measured from movement initiation to step finalization (step down) and total response time (RsT) measured as the sum of RT and MT.28–30
 A custom-made Choice Stepping Reaction Time step pad (CSRT-MAT). B) An example screen for Choice Stepping Reaction Time (CSRT) measurement. Each panel on the mat contains a switch that could be read by the controlling computer software. Participants stand on the 2 central stance panels and respond (step) to stimuli presented on the computer display screen. One of four arrows on the screen changes its color to blue and the participant is asked to step as quickly as possible onto the same location of the pad, for example a front left step as shown in this figure.28")
A) A custom-made Choice Stepping Reaction Time step pad (CSRT-MAT). B) An example screen for Choice Stepping Reaction Time (CSRT) measurement. Each panel on the mat contains a switch that could be read by the controlling computer software. Participants stand on the 2 central stance panels and respond (step) to stimuli presented on the computer display screen. One of four arrows on the screen changes its color to blue and the participant is asked to step as quickly as possible onto the same location of the pad, for example a front left step as shown in this figure.28
The SLS test was used to evaluate static balance performed with eyes closed and arms on the hips. A chronometer was used to measure the amount of time the individual was able to stand on one limb. Time commenced when the individual raised the foot off the floor and ended when the leg touched the ground or to the supported leg for support or the arms left the hips. This test is evaluated separately for the right and left extremities. The total score of the test was obtained by taking the average of the 3 trial scores.31
Y-balance test (YBT)The YBT was performed to evaluate dynamic balance. The participants were asked to perform single leg stance while reaching out anterior, posteromedial and posterolateral directions to push a reach indicator box along one of the three arms of the Y-shaped wooden device. Three trials were completed on both limbs and the maximal reach distance was recorded at the place where the most distal parts of the foot reached in three directions. The composite reach distance (%) was calculated with the formula; Sum of the 3 reach directions/3 times the limb length (anterior-superior iliac spine to the lateral malleolus)*100.32,33
Mobility assessmentThe Timed Up and Go (TUG) test was used to evaluate functional mobility. The participants were asked to sit with their back against the chair and then stand up from the chair, walk a distance of 3 m with normal speed, turn, walk back and sit on the chair. The time to complete the task was recorded in seconds. This test was repeated three times, and the average result was recorded for TUG test single tasking (TUG-ST).34 Additionally, dual task activities (TUG-DT) was used: (1) TUG-DTcognitive: the participants were asked to count down in threes from a randomly chosen number between 60–100 while walking, the time to complete and number of correct answers were recorded, and (2) TUG-DTmanual: the participants were asked to transfer a coin from one pocket to another while walking, the time to complete and number of transferred coin were recorded.35,36 Additionally, dual-task cost (DTC) was calculated by dividing the difference between the time required to complete TUG-ST and TUG-DT by the time required to complete TUG-ST for each of the two tasks (TUG-DTcognitive and TUG-DTmanual). A positive cost indicates poorer dual-task performance.37 The DTC was calculated by the formula as follows:
Fear of falling assessmentThe fear of falling was evaluated with the Tinetti Falls Efficacy Scale (FES). FES is a 10-item questionnaire assessing the effects of fear of falling or low perceived self-efficacy in performing daily activities. The participants were asked to score how confident they were while performing these activities without falling; from 1 (very confident) to 10 (not confident at all) and per item ratings were added to obtain the total score.38 The Turkish version of the FES-I has been previously shown to be a reliable and valid measure of fear of falling.39
Statistical analysisThe data were analyzed using IBM SPSS Statistics V.20.0.0. The variables are reported by percentage (%), mean ± standard deviation (x ± sd) and frequency. Shapiro–Wilk test was used to determine whether the data had a normal distribution. Mann–Whitney U test was used for comparison of continuous data, and Chi-Square test and Fisher's exact Chi-Square test were used for comparison of categorical data between the groups. P < 0.05 was accepted as the statistically significant level. Arithmetic means are presented with a 95% confidence interval (95% CI) with lower and upper limit values. P values and 95% CI values were considered while interpreting the differences between the groups.
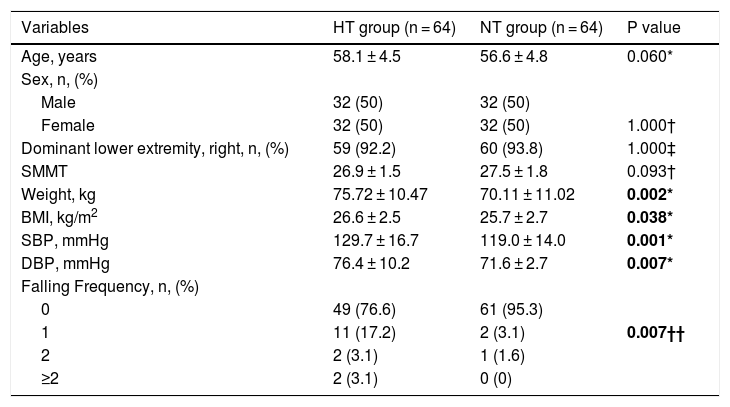
ResultsThe socio-demographic and clinical characteristics of the participants are presented in Table 1. There were no significant differences between the two groups in terms of age, sex, dominant side and mental state.
Socio-demographic and clinical characteristics of participants.
| Variables | HT group (n = 64) | NT group (n = 64) | P value |
|---|---|---|---|
| Age, years | 58.1 ± 4.5 | 56.6 ± 4.8 | 0.060* |
| Sex, n, (%) | |||
| Male | 32 (50) | 32 (50) | |
| Female | 32 (50) | 32 (50) | 1.000† |
| Dominant lower extremity, right, n, (%) | 59 (92.2) | 60 (93.8) | 1.000‡ |
| SMMT | 26.9 ± 1.5 | 27.5 ± 1.8 | 0.093† |
| Weight, kg | 75.72 ± 10.47 | 70.11 ± 11.02 | 0.002* |
| BMI, kg/m2 | 26.6 ± 2.5 | 25.7 ± 2.7 | 0.038* |
| SBP, mmHg | 129.7 ± 16.7 | 119.0 ± 14.0 | 0.001* |
| DBP, mmHg | 76.4 ± 10.2 | 71.6 ± 2.7 | 0.007* |
| Falling Frequency, n, (%) | |||
| 0 | 49 (76.6) | 61 (95.3) | |
| 1 | 11 (17.2) | 2 (3.1) | 0.007†† |
| 2 | 2 (3.1) | 1 (1.6) | |
| ≥2 | 2 (3.1) | 0 (0) |
HT: Hypertensive; NT: Normotensive; SMMST: Standardized Mini Mental Test; BMI: Body Mass Index; SBP: Systolic Blood Pressure; DBP: Diastolic Blood Pressure; *: Mann–Whitney U test; †: Chi- Square test; ††: Fishers Chi-Square test. Bold numbers indicate difference between groups (P < 0.05) Data are mean ± standard deviation, unless indicated.
The mean SBP and DBP in the HT group were significantly higher in comparison to the NT group (p < 0.05) (Table 1).
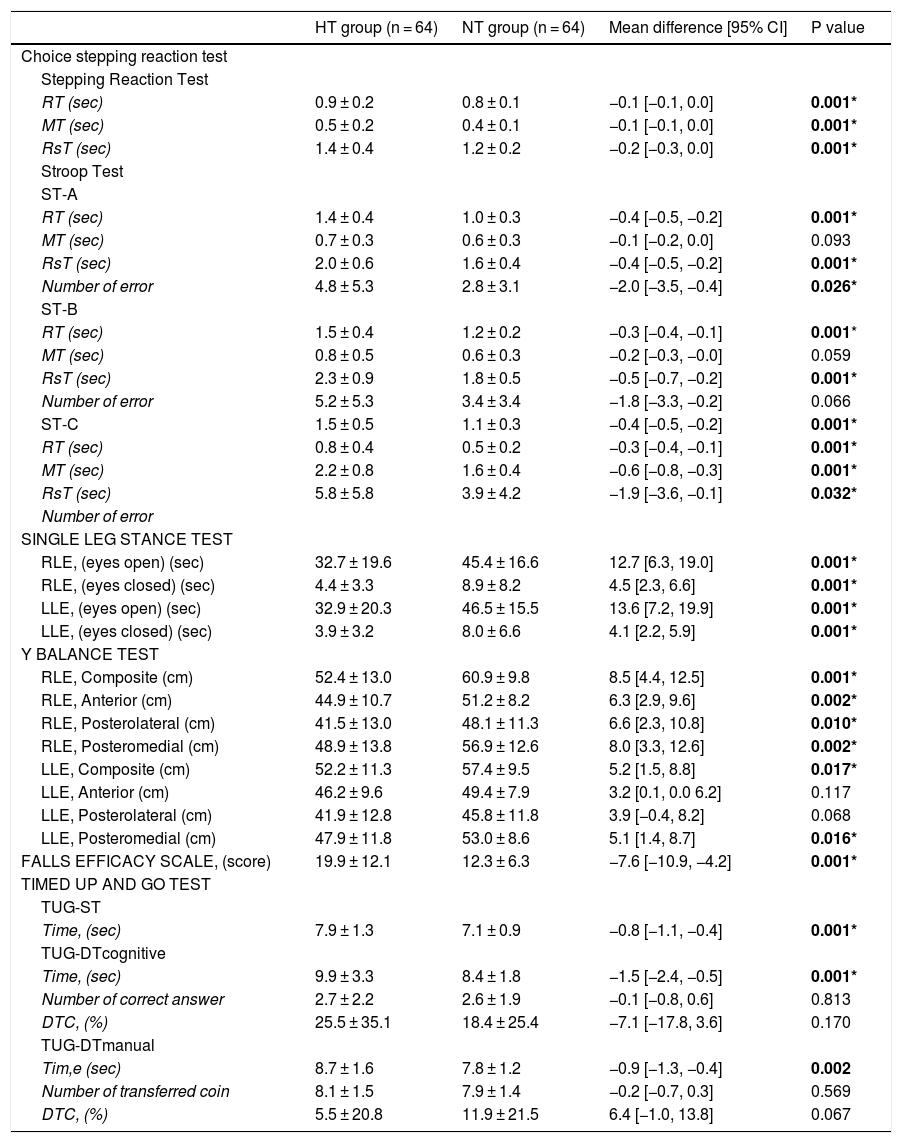
Processing speed assessmentAccording to the CSRT test results, RsT time and RT were significantly longer in the HT group than the NT group in all tests (p < 0.05). The error rate in the ST-A and ST-C tests in the HT group was higher than that in the NT group (p < 0.05). There was no significant difference in MT time between the groups in the ST-A test and the ST-B test. The error rate was not significantly different between the two groups in the ST- B test (p > 0.05) (Table 2).
Comparison of the choice stepping reaction test, single leg stance test, Y balance test, falls efficacy scale and timed up and go tests results of the HT and NT groups.
| HT group (n = 64) | NT group (n = 64) | Mean difference [95% CI] | P value | |
|---|---|---|---|---|
| Choice stepping reaction test | ||||
| Stepping Reaction Test | ||||
| RT (sec) | 0.9 ± 0.2 | 0.8 ± 0.1 | −0.1 [−0.1, 0.0] | 0.001* |
| MT (sec) | 0.5 ± 0.2 | 0.4 ± 0.1 | −0.1 [−0.1, 0.0] | 0.001* |
| RsT (sec) | 1.4 ± 0.4 | 1.2 ± 0.2 | −0.2 [−0.3, 0.0] | 0.001* |
| Stroop Test | ||||
| ST-A | ||||
| RT (sec) | 1.4 ± 0.4 | 1.0 ± 0.3 | −0.4 [−0.5, −0.2] | 0.001* |
| MT (sec) | 0.7 ± 0.3 | 0.6 ± 0.3 | −0.1 [−0.2, 0.0] | 0.093 |
| RsT (sec) | 2.0 ± 0.6 | 1.6 ± 0.4 | −0.4 [−0.5, −0.2] | 0.001* |
| Number of error | 4.8 ± 5.3 | 2.8 ± 3.1 | −2.0 [−3.5, −0.4] | 0.026* |
| ST-B | ||||
| RT (sec) | 1.5 ± 0.4 | 1.2 ± 0.2 | −0.3 [−0.4, −0.1] | 0.001* |
| MT (sec) | 0.8 ± 0.5 | 0.6 ± 0.3 | −0.2 [−0.3, −0.0] | 0.059 |
| RsT (sec) | 2.3 ± 0.9 | 1.8 ± 0.5 | −0.5 [−0.7, −0.2] | 0.001* |
| Number of error | 5.2 ± 5.3 | 3.4 ± 3.4 | −1.8 [−3.3, −0.2] | 0.066 |
| ST-C | 1.5 ± 0.5 | 1.1 ± 0.3 | −0.4 [−0.5, −0.2] | 0.001* |
| RT (sec) | 0.8 ± 0.4 | 0.5 ± 0.2 | −0.3 [−0.4, −0.1] | 0.001* |
| MT (sec) | 2.2 ± 0.8 | 1.6 ± 0.4 | −0.6 [−0.8, −0.3] | 0.001* |
| RsT (sec) | 5.8 ± 5.8 | 3.9 ± 4.2 | −1.9 [−3.6, −0.1] | 0.032* |
| Number of error | ||||
| SINGLE LEG STANCE TEST | ||||
| RLE, (eyes open) (sec) | 32.7 ± 19.6 | 45.4 ± 16.6 | 12.7 [6.3, 19.0] | 0.001* |
| RLE, (eyes closed) (sec) | 4.4 ± 3.3 | 8.9 ± 8.2 | 4.5 [2.3, 6.6] | 0.001* |
| LLE, (eyes open) (sec) | 32.9 ± 20.3 | 46.5 ± 15.5 | 13.6 [7.2, 19.9] | 0.001* |
| LLE, (eyes closed) (sec) | 3.9 ± 3.2 | 8.0 ± 6.6 | 4.1 [2.2, 5.9] | 0.001* |
| Y BALANCE TEST | ||||
| RLE, Composite (cm) | 52.4 ± 13.0 | 60.9 ± 9.8 | 8.5 [4.4, 12.5] | 0.001* |
| RLE, Anterior (cm) | 44.9 ± 10.7 | 51.2 ± 8.2 | 6.3 [2.9, 9.6] | 0.002* |
| RLE, Posterolateral (cm) | 41.5 ± 13.0 | 48.1 ± 11.3 | 6.6 [2.3, 10.8] | 0.010* |
| RLE, Posteromedial (cm) | 48.9 ± 13.8 | 56.9 ± 12.6 | 8.0 [3.3, 12.6] | 0.002* |
| LLE, Composite (cm) | 52.2 ± 11.3 | 57.4 ± 9.5 | 5.2 [1.5, 8.8] | 0.017* |
| LLE, Anterior (cm) | 46.2 ± 9.6 | 49.4 ± 7.9 | 3.2 [0.1, 0.0 6.2] | 0.117 |
| LLE, Posterolateral (cm) | 41.9 ± 12.8 | 45.8 ± 11.8 | 3.9 [−0.4, 8.2] | 0.068 |
| LLE, Posteromedial (cm) | 47.9 ± 11.8 | 53.0 ± 8.6 | 5.1 [1.4, 8.7] | 0.016* |
| FALLS EFFICACY SCALE, (score) | 19.9 ± 12.1 | 12.3 ± 6.3 | −7.6 [−10.9, −4.2] | 0.001* |
| TIMED UP AND GO TEST | ||||
| TUG-ST | ||||
| Time, (sec) | 7.9 ± 1.3 | 7.1 ± 0.9 | −0.8 [−1.1, −0.4] | 0.001* |
| TUG-DTcognitive | ||||
| Time, (sec) | 9.9 ± 3.3 | 8.4 ± 1.8 | −1.5 [−2.4, −0.5] | 0.001* |
| Number of correct answer | 2.7 ± 2.2 | 2.6 ± 1.9 | −0.1 [−0.8, 0.6] | 0.813 |
| DTC, (%) | 25.5 ± 35.1 | 18.4 ± 25.4 | −7.1 [−17.8, 3.6] | 0.170 |
| TUG-DTmanual | ||||
| Tim,e (sec) | 8.7 ± 1.6 | 7.8 ± 1.2 | −0.9 [−1.3, −0.4] | 0.002 |
| Number of transferred coin | 8.1 ± 1.5 | 7.9 ± 1.4 | −0.2 [−0.7, 0.3] | 0.569 |
| DTC, (%) | 5.5 ± 20.8 | 11.9 ± 21.5 | 6.4 [−1.0, 13.8] | 0.067 |
SRT: Stepping Reaction Time; ST: Stroop Test; RT: Reaction Time; MT: Movement Time, RsT: Response Time; (sec): Second; (cm): Centimeter; RLE: Right Lower Extremity; LLE: Left Lower Extremity; RLE: Right Lower Extremity; LLE: Left Lower Extremity; TUG-ST: Timed Up and Go Test- Single Tasking; TUG-DTcognitive: Timed Up And Go Test- Dual Tasking Cognitive; TUG-DTmanual: Timed Up And Go Test- Dual Tasking Manual; DTC: Dual Task Cost; * Mann–Whitney U test; Bold numbers indicate difference between groups (P < 0.05). :
The HT group had significantly lower scores in the SLS test in comparison to the NT group, on both sides and in both conditions (eyes open and closed) (p < 0.05) (Table 2). The YBT test results showed that the HT group had a shorter reaching distance than the NT group (p < 0.05), except for the left anterior and posterolateral directions (p > 0.05) (Table 2).
Mobility assessmentThe mean TUG-ST test times were significantly longer in the HT group than the NT group (p < 0.05). The mean times on TUG-DTcognitive and TUG-DTmanual were found to be longer in the HT group than the NT group (p < 0.05). The number of correct answers in the TUG-DTcognitive test and the number of transferred coins in the TUG-DTmanual test were not significantly different (p > 0.05). The DTC for TUG-DTcognitive test and TUG-DTmanual test percentages was not different between the HT and NT groups (p > 0.05) (Table 2).
Fear of falling assessmentThe FES results were significantly higher in the HT group in comparison to the NT group (p < 0.05)] (Table 2). According to the subjective falling reports of the participants, the falling frequency were higher in the HT group (23.4%) [95% CI; 13.0, 33.7] in comparison to the NT group (4.7%) [95% CI; 0.4, 9.8] (p < 0.05) (Table 1).
DiscussionThis study compared processing speed, static and dynamic balance, functional mobility and fear of falling in individuals who were diagnosed with HT and normotensive individuals. The individuals in the HT group was found to have slower processing speed, reduced static and dynamic balance, decreased functional mobility during both single and dual tasking, and higher fear of falling compared to the NT group.
The processing speed of the HT group in our study was slower in comparison to the NT group. There are conflicting results in the literature related to the processing speed of individuals with HT in comparison to NT.13–19 In a study by Edwards et al.18 simple reaction time (SRT) measured in HT and NT individuals did not differ in terms of both premotor (central processing) and motor reaction times.18 The measurement procedure in the previous study for processing speed was different from our study (CRT-choice reaction time). The difficulty level for allocating the stimulus and effector selection was lower when the attention should be focused continuously on one specific stimulus as in the SRT task in comparison to the task where the attention must be divided among different stimuli as in the CRT task.18,40 Kovacs et al.19 also reported no significant difference in reaction time between the HT and NT groups, which used SRT and CRT tasks in their measurement protocol.19
It should be taken into account that all the previous studies evaluated the processing speed of upper extremities.13–19 Lower extremities may require less processing time than upper extremities due to lower nerve conduction velocities and longer nerve pathways.41 Therefore, it may take more time to overcome the inertia in lower extremities relative to upper extremities due to the higher mass of the lower extremity. It was suggested that the level of complexity is higher for selecting lower extremity movements relative to upper extremity movements41 therefore safety issues are also more important for lower extremities during activities of daily living (ADLs) such as walking, crossing traffic lights and driving. To our knowledge, this is the first study that compared the processing speed during activities requiring the transfer of body weight between lower extremities between hypertensive and normotensive individuals. In this sense, slower processing speed in the HT group in comparison to the NT group is an important finding of this study. However, these results should be interpreted cautiously because the mean differences between groups was very low. The small difference might be due to the fact that the processing speed is expressed in very small units (seconds). Although the mean difference was low for both of the CSRT testing protocols, it was extremely low in the SRT which requires less cognitive ability than the ST. This may indicate that cognitive skills may have a greater effect on the processing speed.
Slower processing speed of the lower extremities, especially during ADLs, may lead to balance problems and risk of falling which constitutes an important problem for safety. Beside decreased processing speed, antihypertensive medications and the systemic effects of HT on the arterial structure and microcirculation are possible factors leading to balance problems in patients with HT.42–45 Moreover, the increased heart rate in individuals with HT may lead to increased postural oscillations and static balance disturbances.46 In our study, the static balance measurements, in both eyes open and eyes closed, of the HT group were lower in comparison to the NT group. Conversely, Acar et al.43 and Abate et al.42 reported no significant difference in balance tests between normotensive and hypertensive individuals.43 The difference to previous studies was the age of the participants. The average age of the participants included in the previously mentioned studies were higher that of our study. To exclude the effects of aging on balance, we include the participants aged between 50–65, with an average age 58.1 ± 4.5 in the HT group and 56.6 ± 4.8 in the NT group, in our study. Therefore, we assume that the postural control of healthy individuals is at the optimum level, and presumably the difference between the HT and NT groups in static balance was due to hypertension-related changes, and it was not age-dependent.
Hausdorff et al.24 investigated “treated” hypertension and balance functions in older adults, and reported that HT affected reactive balance control and functional mobility.24 Similarly, we observed that the dynamic balance in the HT group was lower in comparison to the NT group. The dynamic balance testing (YBT) that was used in our study measures the proactive balance ability while reaching different directions and maintaining the balance, which is frequently performed in ADLs (i.e., stepping towards various directions). Almost all ADLs require multiple activities to be performed simultaneously; therefore, dual task activities are more common in our daily lives than single tasks such as walking and searching something in our pocket.47 It is possible for individuals with HT to experience difficulties during dual tasks, due to decreased motor (e.g., reaction time, balance) and cognitive (e.g., attention) functions.48–50 The results of this study showed that functional mobility during both single and dual tasks were decreased in the HT group compared to the NT group, and the decrease was greater during dual tasks including cognitive functions. This was compatible with the DTC percentages indicating no difference between the HT and NT groups for both cognitive and manual dual tasks. However, the DTC was greater during cognitive dual tasks in both groups. This might indicate that dual-task performance is poor especially during cognitive dual tasks rather that manual dual tasks. This may be explained with the suggestion that attention is a limited resource, performing the two tasks simultaneously may lead to a performance decrease especially during cognitive tasks that involve internal interfering factors (i.e., arithmetic tasks) more than tasks involving external interfering factors (i.e., reaction time tasks).51
Prolonged processing time, balance dysfunctions and decreased functional mobility may increase the fear of falling in HT individuals. Some studies have argued that, depending on the type, dose and duration of antihypertensive medications, the sudden decrease in blood pressure and orthostatic hypotension may lead to an increased risk of falling.52,53 In comparison to the NT group, fear of falling and subjective falls history were found to be higher in the HT group. Individuals in the HT group defined increased postural sway and balance problems immediately especially after the use of antihypertensive drugs. Although we excluded individuals with orthostatic hypotension from the study, we did not consider the effects of antihypertensive medication. The fact that we measured the individuals at random times during the day prevented us from evaluating the effects of medications, which was an important limitation of this study. For obtaining more information about the effects of antihypertensive drugs, we suggest that the measurements should be made at the same time of the day for each individual or at a certain time after taking the antihypertensive medication (e.g., morning hours) in future studies. Additionally, besides the medications and the time of the day there are many other factors like alcohol use, caffeine use, nicotine use and exercise within 30 min before BP measurement. The participants in our study were not given detailed instructions that may have direct influence on the BP before coming for evaluation, therefore, this was another limitation of our study.
ConclusionHypertensive individuals present slower processing speed, reduced static and dynamic balance, decreased functional mobility during both single and dual tasking and higher fear of falling in comparison to normotensive individuals. These findings expand the body of knowledge about the effects HT on physical functions like prolonged processing time, disturbed balance and reduced mobility functions which may guide clinicians in including preventive and rehabilitative strategies to their therapy protocols in order to improve the quality of life of the individuals with HT.


