

High blood pressure is strongly associated with obesity in different populations. However, it is unclear whether different anthropometric indicators of obesity can satisfactorily predict high blood pressure in the school setting.
ObjectivesThis study evaluated the sensitivity and specificity of body mass index, waist circumference, and waist to height ratio in the detection of high blood pressure in adolescents.
MethodsThe sample consisted of 8295 adolescents aged 10–17 years. Weight was measured using a digital scale, height with a stadiometer, and waist circumference using a tape measure. Blood pressure was measured by an automatic blood pressure measuring device. ROC curves were used for the analysis of sensitivity and specificity of the three anthropometric indices in identifying high blood pressure. Binary Logistic Regression was used to assess the association of body mass index, waist circumference, and waist to height ratio with high blood pressure.
ResultsLow values of sensitivity were observed for body mass index (0.35), waist circumference (0.37), and waist to height ratio (0.31) and high values of specificity for body mass index (0.86), waist circumference (0.82), and waist to height ratio (0.83) in the detection of high blood pressure. An association was observed between adolescents classified with high body mass index (OR=3.57 [95% CI=3.10–4.10]), waist cirumference (OR=3.24 [95% CI=2.83–3.72]), and waist to height ratio (OR=2.94 [95% CI=2.54–3.40]) with high blood pressure.
ConclusionsBody mass index, waist circumference, and waist to height ratio presented low sensitivity to identify adolescents with high blood pressure. However, adolescents classified with high body mass index, waist circumference, and waist to height ratio demonstrated a high association of presenting high blood pressure.
Anthropometric parameters have been widely used to identify subjects with high blood pressure (HBP). Body mass index (BMI) and waist circumference (WC) have been associated with high blood pressure in adolescents.1–3 Recently, the waist to height ratio (WTHR) has been proposed as a simpler tool to diagnose obesity, since it does not require the use of specific tables for sex and age.
In fact, studies with children and adolescents have pointed out that elevated WTHR is associated with cardiovascular diseases.4,5 However a study with 5207 children in Switzerland did not find good predictive power of WTHR to identify children with HBP.6 Part of this controversy may be explained by the different populations studied, suggesting that the efficiency of anthropometric parameters to predict cardiovascular risk seems to be dependent on the characteristics of the sample. Another factor to consider is the different ages of the samples included in the studies. The study by Hara et al.5 evaluated children and adolescents aged 9–13 years4; Genovesi et al.4 evaluated young people from 5 to 11 years; while in the study of Chiolero et al.6 the age range of the sample was 10–14 years.
Anthropometric measures related to high blood pressure could be an important alternative for the identification of this condition in environments such as schools, where blood pressure measurement can be hampered by having to be carried out on a large scale, added to the difficulty of measuring this population. Moreover, a better statistical procedure may assist in determining the best identification method.
As statistical procedures, including the quantification of sensitivity, specificity and areas under the curve of anthropometric indicators could provide further insights into the comparison of methods. In addition, anthropometric parameters may identify subjects at risk of hypertension. The aims of this study were to investigate the relationship between BMI, WC, and WTHR with HBP in adolescents and to determine the sensitivity and specificity of these indices to identify HBP in adolescents.
MethodsSampleThis study was performed using the databases from two school based studies involving adolescents (aged 10–17 years) in the states of Paraná (Southern Brazil) and Pernambuco (Northeastern Brazil). Detailed information regarding sampling had been previously described elsewhere.7–9 The study sample was composed of 8295 adolescents. This study was previously approved by the Ethics in Research Committee of the Universidade Estadual de Londrina-UEL (CAAE: 0181.0.268.000-10; Londrina, Paraná state) and Universidade de Pernambuco-UPE (CAAE-0158.0.097.000-10; Recife, Pernambuco state) and was conducted in accordance with the Declaration of Helsinki. All adolescent participants in the study received approval from a parent or guardian.
Anthropometric measuresThe adolescents wore light clothing during all measurements. Body mass was measured using a digital scale with a precision of 0.1kg and a maximum capacity of 150kg. Height was measured using a portable stadiometer with an accuracy to 0.1cm. BMI was calculated by dividing body mass by the height squared (kg/m2). WC was obtained using a tape measure to the nearest 0.1cm (the average of two measures was used). The WTRH was obtained by dividing the waist circumference by the height. The cutoff points used for BMI, WC, and WTHR were those proposed by Cole et al.,10 Taylor et al.,11 and McCarthy et al.,12 respectively.
Blood pressureThe day before the blood pressure assessment, the adolescents were advised in class to avoid certain types of behaviors that could affect the BP, such as drinking caffeinated drinks (including cola soft drinks), exercising, and smoking.
To assess blood pressure, an oscillometric equipment was used (Omron, model HEM 742). This equipment was previously validated for use in adolescents.13 Prior to the blood pressure evaluation, the subjects remained seated at rest for 5min, after which the first measure was taken. For the measurement of BP, two types of cuffs were considered and an appropriate cuff size was used for each adolescent, taking into account arm circumference (6cm×12cm and 9cm×18cm). These procedures were performed in accordance with American Heart Association recommendations.14 Two minutes after the first assessment, the second blood pressure measurement was performed. The average of the two evaluations was used to determine the blood pressure value of the subject (in the study carried out in Londrina; Southern Brazil). In the study conducted in the Northeast, the methodology was the same, except that three evaluations of blood pressure were conducted and the average of the final two assessments was considered in the analyses. The average time interval between second and third blood pressure assessments was 2min.
The table used for the classification of blood pressure in the sample was subject to the National High Blood Pressure Education Program.15 High blood pressure was defined as systolic and/or diastolic blood pressure equal to or higher than the reference for the sex, age, and height-specific 95th percentile.
Statistical analysisContinuous data are presented as mean and standard deviation and categorical data are presented in frequencies. Student t test was used to compare the descriptive characteristics of adolescents with and without HBP. The sensitivity and specificity of the anthropometric indicators to detect HBP were verified through ROC curves. The association between adiposity classification of the three indicators and HBP was determined using multivariate models adjusting for confounders (i.e. sex and age) through binary logistic regression. The statistical significance was set at 5%.
ResultsOf the 8295 adolescents (4877 females and 3418 males) who participated in the study, 1229 (14.8%) presented HBP, with a higher prevalence in males (22.0%) than females (9.7%) (p<0.001). The prevalence of overweight determined by BMI was 16.9% and there was no difference between male (17.1%) and female adolescents (16.7%) (p=0.623). Abdominal obesity was observed in 20.6% of the sample and there was a significant difference between males (16.4%) and females (23.4%) (p<0.001). High WTHR was observed in 18.3% of the adolescents and was higher in females (22.5%) than males (12.2%) (p<0.001).
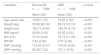
Table 1 shows the characteristics of the sample stratified by blood pressure (i.e. normal or high). Adolescents with HBP were taller, heavier, had higher values of BMI, WC, and WTHR, and higher values of SBP and DBP than their peers with normal BP.
Characteristics of the study adolescents (10–17 years) according to blood pressure classification.
| Variables | Normal BP n=7066 | HBP n=1229 | p-value |
|---|---|---|---|
| Mean (SD) | Mean (SD) | ||
| Age (years old) | 15.85 (1.97) | 16.05 (1.83) | <0.001 |
| Weight (kg) | 55.58 (65.74) | 65.74 (16.10) | <0.001 |
| Height (cm) | 162.71 (9.54) | 166.76 (9.70) | <0.001 |
| BMI (kg/m2) | 20.89 (3.45) | 23.50 (4.82) | <0.001 |
| WC (cm) | 73.15 (9.00) | 79.73 (11.78) | <0.001 |
| WTHR | 0.45 (0.05) | 0.47 (0.06) | <0.001 |
| SBP (mmHg) | 112.42 (9.07) | 135.00 (8.25) | <0.001 |
| DBP (mmHg) | 65.39 (7.32) | 75.11 (9.59) | <0.001 |
Legends: BMI, body mass index; WC, waist circumference; WTHR, waist to height ratio; SBP, systolic blood pressure; DBP, diastolic blood pressure.
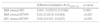
The three indicators analyzed indicated low sensitivity and good specificity (Table 2). In other words, they are good for detecting actual cases of the disease but they also come with a fairly high rate of false positives.
Diagnostic properties of different anthropometric indicators in the detection of HBP in study adolescents.
| AUC(95% CI) | Sensitivity(95% CI) | Specificity(95% CI) | PPV(95% CI) | NPV(95% CI) | |
|---|---|---|---|---|---|
| BMI | 0.60 (0.59; 0.61) | 0.35 (0.32; 0.37) | 0.86 (0.85; 0.87) | 0.30 (0.28; 0.33) | 0.88 (0.87; 0.89) |
| WC | 0.59 (0.58; 0.60) | 0.37 (0.34; 0.40) | 0.82 (0.81; 0.83) | 0.26 (0.24; 0.29) | 0.88 (0.87; 0.89) |
| WTHR | 0.57 (0.56; 0.58) | 0.31 (0.28; 0.33) | 0.83 (0.82; 0.84) | 0.25 (0.22; 0.27) | 0.87 (0.86; 0.88) |
Legends: BMI, body mass index; WC, waist circumference; WTHR, waist to height ratio; AUC, area under the curve; 95% CI, 95% confidence interval; PPV, positive predictive value; NPV, negative predictive value.
Table 3 presents information regarding the comparison of the ROC curve between different anthropometric indices in predicting HBP. There was no significant difference between WC and BMI. However, a significant difference was observed when comparing WC with WTHR and BMI with WTHR.
Comparison between ROC curves of different anthropometric indices for high blood pressure (n=8225) in subjects 10–17 years of age.
| Difference between AUC(95% CI) | p-value | |
|---|---|---|
| BMI versus WC | 0.09 (−0.00515; 0.0189) | 0.063 |
| BMI versus WTHR | 0.03 (0.0218; 0.0434) | <0.001 |
| WC versus WTHR | 0.02 (0.0141; 0.0327) | <0.001 |
Legends: BMI, body mass index; WC, waist circumference; WTHR, waist to height ratio; AUC, area under the curve; 95% CI, 95% confidence interval.
Adolescents who were classified as overweight in any of the three anthropometric indices presented higher associations with HBP, even after adjusting for sex and age (Table 4).
Crude and adjusted associations between body fat composition and high blood pressure in adolescents (n=8225) aged 10–17 years of age.
| High blood pressure | |||||
|---|---|---|---|---|---|
| Crude | Adjusted (age and sex) | ||||
| OR | 95% CI | OR | 95% CI | p-value | |
| Normal BMI | Ref | – | Ref | – | – |
| Overweight | 3.39 | 2.96–3.88 | 3.57 | 3.10–4.10 | <0.001 |
| Normal WC | Ref | – | Ref | – | – |
| Abdominal obesity | 2.76 | 2.42–3.14 | 3.24 | 2.83–3.72 | <0.001 |
| Normal WTHR | Ref | – | Ref | – | – |
| High WTHR | 2.33 | 2.03–2.67 | 2.94 | 2.54–3.40 | <0.001 |
Legends: BMI, body mass index; WC, waist circumference; WTHR, waist to height ratio; OR, odds ratio; 95% CI, 95% confidence interval, Ref, reference.
In the present study, adiposity was higher in girls than in boys, which corroborates recent findings by Minges et al.16 One of the possible explanations for these results is that the majority of the sample of this work was composed of adolescents aged 15 years or older. Therefore, the hormonal factors inherent in the young population, may contribute in this phase to increase the muscle mass of male adolescents and greater fat deposition in female adolescents.17 Another factor that should also be considered is that the different types of cutoff points for abdominal adiposity (BMI, waist circumference, and waist to height ratio) were elaborated by different studies in which the prevalence of body adiposity might have varied.
In the present investigation, BMI, WC, and WTHR presented low sensitivity and high specificity to predict HBP. In the same way, Keefer et al.,18 evaluating 2300 adolescents, reported moderate sensitivity and specificity of BMI and WTHR to detect HBP. On the other hand, high values of area under the curve and sensitivity of WTHR to blood pressure were found by Kuba et al.19 evaluating 175 children aged 6–10 years. However, corroborating our results, Freedman et al.20 observed a predictive power of 33% for BMI and WTHR for identification of SBP in a study of 2498 children and adolescents aged 5–17 years.
The observed differences may be, at least in part, related to the different cutoff points used in the classification of BMI, WC, and WTHR. Another factor is the way in which blood pressure was measured. In the current study an automatic device was used to measure blood pressure and the mean of two measurements, with an interval of 2min between the two measurements, whereas Kuba et al.19 used a mercury sphygmomanometer and mean arterial blood pressure with an interval of 45 days between the first and second measurements. In fact, a previous investigation showed that the procedures for measuring blood pressure directly affect the results.21 Another factor is the age range of the subjects used in the study, whereas our sample consisted of adolescents aged 10–17 years, the work of Kuba et al.19 included children from 6 to 10 years. Furthermore, when comparing studies, ethnicity and cultural aspects should be considered, as these factors could influence the results. Studies have shown that African American descendants are more likely to present with HBP.22,23 This factor may explain the discrepancies between the studies, since the Brazilian population constitutes largely African American descendants when compared to the study of Hara et al.,5 which consisted of Oriental subjects.
When comparing the area under the curve of the three indicators, no difference was observed between BMI and WC. However, there were statistically significant differences between BMI-WTHR and WC-WTHR. This may be due to the small but significant difference between the higher sensitivity of BMI and WC compared to WTHR. Despite the differences between the curves, all three indicators presented values that could be considered low for the identification of HBP. However, when examining whether adolescents classified as overweight in the three indicators were more likely to present with HBP, significant associations were observed, even after adjusting for confounding variables such as sex and age.
Graves et al.,24 in a prospective epidemiological study of children and adolescents, found significant relationships between BMI and WTHR and higher systolic and diastolic blood pressure. These results have also been reported in other studies.25,26 Several physiological mechanisms can explain this relationship, since adipose tissue releases inflammatory cytokines, including TNF-α and IL-6. These cytokines act in the vessels, leading to alterations in the sympathetic nervous system and endothelial function, and contributing to changes in blood pressure.27,28
Despite the low sensitivity value observed by the three anthropometric indices used to identify HBP, we can emphasize the practical application of this study. In a school environment, in which it is often difficult to measure the blood pressure of adolescents due to other school activities, the assessment of the three anthropometric indicators could be an alternative screening method for young people with HBP. Adolescents rated as overweight in the three indices could be referred to a basic health unit for more detailed monitoring. After further analysis, the present study found that adolescents classified as overweight in the three indices were about 4 times more likely to demonstrate HBP compared to adolescents classified as normal in the three anthropometric indicators.
The limitations of this study include the measurement of blood pressure on a single occasion, since the measurement of blood pressure on a single day may overestimate the prevalence of high blood pressure.29 Another limiting factor to be considered is the cross-sectional study design that prevented analysis of causal relationships. The absence of ethnicity assessment should also be considered, since young black individuals might present with higher blood pressure values when compared to other ethnicities.30 In addition, the non-evaluation of maturation in the sample should be considered as a limitation, since this variable could influence blood pressure values in adolescents.
There was a statistically significant association between three anthropometric indicators (i.e. WC, BMI, and WTHR) and HBP in adolescents. However, these indicators presented low ability to diagnose HBP in adolescents. In clinical practice, although the adiposity measure cannot replace the blood pressure measurement, in the studies with large populations for the purpose of screening, the present methodology could be used, since adolescents classified with high adiposity in the three anthropometric indices were more likely to present HBP.
Conflicts of interestThe authors declare no conflicts of interest.