


Adequate muscle strength is essential for walking performance in individuals with stroke.
ObjectiveTo investigate the accuracy of different forms of muscle knee extension strength analysis to identify high or low walking performance in individuals with chronic stroke.
MethodsTwenty-eight participants with a chronic stroke for more than six months participated. Independence for walking was judged by measurement of walking performance assessed for comfortable walking speed (CWS), maximum walking speed (MWS), and the Six Minute Walk Test (6MWT). Peak knee extension torque of the paretic side, non-paretic side, sum of the sides (SS), and difference in the sides (DS) was assessed during concentric movements using an isokinetic dynamometer.
ResultsThe equation with greatest predictive capacity for CWS and MWS included the DS as the main predictor (R2 of 0.65 and 0.71, respectively, p < 0.05). The variable with the greatest predictive capacity for 6MWT was time since injury (R2 of 0.68, p < 0.05). The highest percentile for CWS in the receiver operating characteristic curve of DS was 25 Nm/kg (cut-off: -12.75 for CWS of 0.498 m/s). The 75th percentile of the 6MWT (324.3 m) was used as the cut-off for the SS (2.1 Nm/kg). The area under the curve for CWS was 0.76 (p < 0.05) on the DS and 0.75 (p < 0.05) for 6MWT on the SS.
ConclusionThe models of muscle knee extension strength analysis using the SS and DS presented moderate accuracy to identify walking performance in individuals with chronic stroke.
Muscle strength on the paretic side (PS) in individuals with stroke is a predictive factor for better walking performance,1,2 maximum walking speed (MWS),3 comfortable walking speed (CWS),3–8 performance during stair-climbing,7,9 higher functional independence,10 and adequate dynamic postural balance.11 But, there is also evidence showing strength deficits on the non-paretic side (NPS),12–18 may result from disuse atrophy and a sedentary lifestyle.19 Furthermore, not all the corticospinal axons cross to the contralateral side at the pyramidal decussation.20 Previous studies demonstrated a positive relationship between strength on the NPS and CWS,6,21,22 increased aerobic capacity,5 trunk postural control,12 and stair-climbing ability.7,14
As a consequence of the strength deficits on both the PS and NPS, there is growing evidence on the relevance of considering both sides.23–26 In 1985, the classical study from Nakamura27 proposed to use a ratio between strength on the PS divided by strength on the NPS. More recently, the difference between the PS and NPS strength,26 and the following equation [(NPS – PS) / NPS] were proposed.24 The relationship between PS and NPS strength presented high predictive capacity for CWS, Six Minute Walk Test (6MWT), and increased motor coordination.25 One of the advantages attributed to these models the consideration of strength asymmetry between body sides.26
The use of the difference between the PS and NPS (DS) is limited because it is not possible to analyze the absolute data from each limb,26 or even to consider similar individuals who are clinically distinct. For instance, differences of the same magnitude do not necessarily represent the same strength level for two individuals. Hence, this difference can be biased. Restrictions imposed by the DS demonstrate that new models need to be developed, such as the sum of the strength of the sides (SS), which might be useful to predict a suitable level of walking performance in chronic stroke survivors.28
Even though models of strength analysis (PS, NPS, DS, and SS) are useful and widely adopted in clinical practice, we raise a question about the accuracy of these models to identify walking performance in individuals with chronic stroke. One strategy that might be useful to investigate this accuracy is the receiver operating characteristic (ROC) curve, which is recognized as a method for selecting an optimal cut-off point for a test and comparing the accuracy between diagnostic tests.29 Therefore, this study aimed to estimate the accuracy of different models of knee extensor strength analysis (i.e., PS, NPS, DS, and SS) to identify high or low walking performance in individuals with chronic stroke.
MethodsStudy designA cross-sectional study with analytical components, reported according to the Strengthening the Reporting of Observational Studies in Epidemiology (STROBE) guideline.
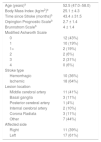
ParticipantsTwenty-eight participants (10 men and 18 women) with chronic stroke for more than six months were included (Table 1). Individuals with stroke were recruited consecutively in the outpatient service of a rehabilitation hospital. The data collection period was June 2014 to March 2015.
Characteristics of the participants (n = 28).
| Age (years)a | 52.5 (47.0−58.0) |
| Body Mass Index (kg/m2)b | 25.1 ± 4.3 |
| Time since Stroke (months)b | 43.4 ± 31.5 |
| Orpington Prognostic Scaleb | 2.7 ± 1.4 |
| Brunnstrom Scaleb | 4 ± 1.4 |
| Modified Ashworth Scale | |
| 0 | 12 (43%) |
| 1 | 10 (19%) |
| 1+ | 2 (19%) |
| 2 | 2 (6%) |
| 3 | 2 (31%) |
| 4 | 0 (6%) |
| Stroke type | |
| Hemorrhagic | 10 (36%) |
| Ischemic | 18 (64%) |
| Lesion location | |
| Middle cerebral artery | 11 (41%) |
| Basal ganglia | 3 (11%) |
| Posterior cerebral artery | 1 (4%) |
| Internal cerebral artery | 2 (10%) |
| Corona Radiata | 3 (11%) |
| Other | 7 (44%) |
| Affected side | |
| Right | 11 (39%) |
| Left | 17 (61%) |
Inclusion criteria were: a diagnosis of stroke (hemorrhagic or ischemic) and values greater than 1 for the Brunnstrom scale.30 Individuals were excluded if they had complete hemiplegia or paraplegia; any cardiac or orthopedic conditions that prevented the performance of the tests and evaluations; if they did not understand/express at least a simple verbal command; and if they could not walk for a least 10 m without assistance from other people. The use of walking aids was not considered an exclusion criterion and the participants performed the walking tests using their daily walking aid.
The Ethics Committee of SARAH Network of Rehabilitation Hospitals granted approval under protocol n. 36769514.0.0000.0022, and all participants provided written informed consent.
ProceduresThe participants with stroke were assessed with the Orpington Prognostic Scale (OPS) to determine the severity of the stroke. For the OPS, scores lower than three represent a “good prognosis”, between three and five a “moderate prognosis”, and values higher than five constitute a “poor prognosis”.31 The Brunnstrom Scale was applied for analyzing lower limb movements, in which the classification ranges from no voluntary movement (one point) to combined movements (six points).30 The Stroke Impact Scale is composed of 59 items and evaluates eight domains: strength, manual function, activities of daily living/instrumental activities of daily living, mobility, communication, emotion/memory, thinking, and functional participation. Each item can be scored from one (“cannot perform”) to five (“no difficulty”).32 The modified Ashworth scale33 was applied by an experienced physical therapist to evaluate the muscle tone of the knee extensors. The classification ranges from ‘0’ (no increase in muscle tone) to ‘4’ (motion stiffness).
Walking performanceWalking performance was assessed by measuring: CWS, MWS, and 6MWT. For the CWS and MWS, participants were instructed to walk at a comfortable and maximum pace, respectively, over a 10-m distance.34 The duration of each test (in seconds) was measured with a stopwatch, and the average time of three trials was used for analysis. The tests have high reproducibility with intraclass correlation coefficients (ICC) of 0.94 (CWS) and 0.97 (MWS).35
The 6WMT was performed on a 30-m walkway.36 Participants were instructed to cover as much ground as possible during the 6 min, and were allowed to stop and rest, if necessary. They were instructed to use their daily assistive devices or orthoses if necessary. Standardized verbal encouragement (e.g., “You are doing well, keep up the good work”) was provided to each participant every 1-min. If the participant requested a rest-break, the timer was not stopped during the break and standardized statements were read (e.g., “It has been ___ minutes. Rest as long as you need, and let me know when we can get started again”). The total distance walked (in meters) was used for analysis. The 6MWT has high reproducibility (ICC: 0.99).35
Isokinetic dynamometerAn isokinetic dynamometer (Biodex System 3, Biodex Medical Systems, Shirley, New York, USA) was used to assess peak torque (PT) during concentric knee extension movements. The PT in Nm relative to body weight (Nm/kg) was analyzed. The paretic and non-paretic lower limbs were evaluated. The following variables were used: PT of the PS, PT of the NPS, SS, and DS.
The calibration of the dynamometer was performed according to the manufacturer’s specifications. The participants were positioned on the dynamometer chair to allow for full knee flexion and extension. In this process, full knee extension was referenced as 0°, and we adopted a range of motion from 10° to 90°. The lateral epicondyle of the femur was used as reference point for the axis of rotation of the knee, and was aligned with the dynamometer rotation axis. Hip position was standardized at 100° of flexion (position of the chair's back relative to the seat) for all participants. The gravity correction was obtained by measuring the torque exerted by the resistance pad and the participant’s leg (relaxed) in the terminal extension position. The Biodex Advantage software automatically adjusted the values of the isokinetic variables.
The extensor muscles were chosen in the present study because they are relevant to walking performance in individuals with stroke.6 After a stroke, individuals cannot perform movements with the paretic limb at high angular velocities, mainly due to the spasticity of the antagonist muscles.37 Therefore, the present study selected a velocity of 60°/s for which concentric PT for knee extensors at 60°/s in individuals affected by stroke has shown an ICC ranging from 0.89 to 0.94; standard error of measurement (SEM) for the PS was 10.6 Nm and for the NPS 12.4 Nm; and the smallest real difference (SRD) for the PS was 26% and for the NPS was 48%.35
First, all participants underwent a familiarization procedure characterized by two sets of four submaximal knee extension repetitions at 60°/s. If the individual did not reach a coefficient of variation (CV) less than 20% during the familiarization, the procedure was repeated twice. If, after the third attempt, the participant did not reach a CV of 20%, the familiarization was terminated to prevent muscle fatigue and the participant was excluded. No participants were excluded.
After a rest of 2 min, the volunteers performed the strength test, composed of one set of four maximum isokinetic concentric knee extension repetitions at 60°/s, for both legs, with an interval of two minutes between lower limbs. The NPS was the first side assessed,26 to avoid a learning effect in the non-affected limb. Considering that the non-affected limb has a more preserved physical capacity, this learning effect could influence the results.
Statistical analysisAn a priori sample size calculation was performed based on a linear multiple regression, fixed model, R2 deviation from zero considering an effect size of 0.90, α of 5%, power (1 - β) of 90% with six predictors, which resulted in a necessary sample of 27 individuals (G*Power Statistical Power Analyses software, version 3.1.9.2; Universität Kiel, Germany).
The Shapiro-Wilk test was used to verify the data normality assumptions. For the variables body mass index, time since stroke, OPS, and Brunnstrom scale, the assumptions were met, and the data are presented as mean (and standard deviation). Non-parametric data for age are presented as median and quartiles (25%; 75%). Data regarding the Modified Ashworth Scale, stroke type, lesion location (arteries and hemisphere), and the affected side are presented descriptively (frequency of occurrence).
Stepwise fitting regression analysis starting from linear to cubic order was used to generate equations for predicting walking performance (CWS, MWS, 6MWT). These regression analyses maintain or remove the predictor variables for the best equation models. Data from six variables (PS; NPS; SS; DS; time since injury [TSI], and age) were inputted into the stepwise regression with three predictors to determine the influence on walking performance. The variance inflation factor was calculated to test for collinearity within the independent variables in the final models.
Because there are no previous thresholds of independence for walking performance (CWS, MWS, 6MWT), cut-off points of the strength variables (PS, NPS, SS, and DS) ROC curves were established based on percentiles (5, 10, 25, 50, 75, 90, and 95). The highest percentile with statistical significance for the area under the curve (AUC) was considered for analysis. Based on the CWS, MWS, and 6MWT cut-off points, the participants were classified as having a lesser or higher walking performance. The AUC was used to assess the accuracy and was classified as high (>0.9), moderate (0.7–0.9), low (0.5–0.7), and by chance (below 0.5).38 Based on the CWS, MWS, and 6MWT cut-off points, the participants were classified as having a lesser or higher walking performance.
All analyses were performed on SPSS (version 23.0; SPSS Inc), and Matlab (R2014.A). Significance was set at 5%.
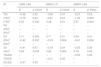
ResultsThe equation with greatest predictive capacity for CWS and MWS consisted of the DS model of muscle knee extension strength analysis as the main predictor variable (R2 = 0.65 and 0.71, respectively, p < 0.05) (Table 2). The variable with the greatest predictive capacity for the 6MWT was TSI (R2 = 0.68; p < 0.05) (Table 2).
Stepwise cubic adjusted R2 values for walking performance (CWS, MWS, and 6MWT), weights (β) and probability values (p) for each predictor variable (PS, NPS, DS, SS, TSI, and age).
| R2 | CWS 0.65 | MWS 0.71 | 6MWT 0.68 | |||
|---|---|---|---|---|---|---|
| β | p-Value | β | p-Value | β | p-Value | |
| TSI | −0.68 | 0.02 | −0.48 | 0.07 | −0.57 | 0.04 |
| (TSI)2 | −0.76 | 0.04 | −0.67 | 0.04 | −1.04 | 0.005 |
| (TSI)3 | 0.53 | 0.002 | 0.48 | 0.01 | 0.57 | 0.004 |
| PS | – | – | – | – | – | – |
| (PS)2 | – | – | – | – | – | – |
| (PS)3 | – | – | – | – | – | – |
| DS | 0.71 | 0.003 | 0.71 | 0.01 | 0.54 | 0.01 |
| (DS)2 | −0.42 | 0.002 | −0.33 | 0.004 | −0.41 | 0.004 |
| (DS)3 | – | – | – | – | – | – |
| SS | −0.41 | 0.07 | −0.18 | 0.24 | −0.20 | 0.20 |
| (SS)2 | 0.54 | 0.004 | 0.62 | 0.004 | 0.78 | 0.20 |
| TSI/DS | – | – | – | – | −0.53 | 0.06 |
| TSI/SS | – | – | −0.31 | 0.05 | – | – |
| DS/SS | −0.37 | 0.05 | – | – | – | – |
Abbreviations: CWS, comfortable walking speed; MWS, maximum walking speed; 6MWT, six minute walk test; TSI, time since injury; PS, paretic side; NPS, non-paretic side; DS, difference in the sides; SS, sum of the sides.
2: quadratic function; 3: cubic function.
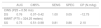
The percentile values (10, 25, 50, 75, and 90) of: the CWS (m/s) were 0.27; 0.50; 0.68; 0.96; 1.42; 1.59; the MWS (m/s) were 0.30; 0.62; 0.89; 0.96;1.24; and the 6MWT (meters) were 99.10; 173.25; 230.50; 354.25; 442.00. The highest percentile for CWS, with statistical significance on the ROC curve of the DS, was 25 Nm/kg (cut-off point of −12.75 Nm/kg for a CWS of 0.498 m/s) (Table 3 and Fig. 1). The 75th percentile of the 6MWT (324.25 m) was used as a cut-off point for the SS (2.10 Nm/kg) (Table 3 and Fig. 2). The ROC analyses revealed that the AUC of the CWS was 0.76 (p < 0.05) for the DS, and the AUC of the 6MWT was 0.75 (p < 0.05) for the SS (Table 3). The AUC in the different percentiles for the PS and NPS, of the CWS and 6MWT, was non-significant. For the MWS, none of the AUCs in the different percentiles for the PS, NPS, DS, and SS were significant.
Results of the receiver operating characteristic curve between different models of peak torque analysis and walking performance. CWS was set at 0.498 (percentile 25) for DS and 6MWT was set at 354.25 (percentile 75) for SS.
| AUC | CI95% | SENS | SPEC | CP (N.m/kg) | |
|---|---|---|---|---|---|
| CWS (P25 = 0.50 m/s) | |||||
| DS | 0.76 | 0.07–0.42 | 1.00 | 0.05 | −12.75 |
| 6MWT (P75 = 324.25 meters) | |||||
| SS | 0.75 | 0.51–0.98 | 0.81 | 0.86 | 2.10 |
Abbreviations: CWS, comfortable walking speed; 6MWT, six minute walk test; AUC, area under the curve; CI95%, 95% confidence interval; SENS, sensitivity; SPEC, specificity; CP, cut-off point for strength;DS, difference in the sides; SS: sum of the sides.
AUC was statistically different from ROC curve reference line for all strength variables (p < 0.05).
 for comfortable walking speed (CWS). CWS cut-off points were set at 0.498 (percentile 25) for DS. The highest percentile with statistical significance for the area under the curve was considered for analysis.")
Receiver operating characteristic curves and cut-off points of difference in the sides (DS) for comfortable walking speed (CWS). CWS cut-off points were set at 0.498 (percentile 25) for DS. The highest percentile with statistical significance for the area under the curve was considered for analysis.
 for six-minute walk test (6MWT). 6MWT cut-off points were set as 324.25 (percentile 75) for SS. The highest percentile with statistical significance for the area under the curve was considered for analysis.")
The aim of this study was to estimate the accuracy of different models of muscle knee extension strength analysis to identify walking performance in individuals with chronic stroke. The present study demonstrated that the SS presented the highest accuracy (classified as moderate) to identify walking performance in individuals with chronic stroke. The DS also showed moderate accuracy to identify walking performance.
The SS and DS demonstrated AUC values ranging from 0.7 to 0.9, which can be interpreted as moderate accuracy39 in determining the 6MWT and CWS in individuals with chronic stroke, respectively. To the best of our knowledge, only one study has determined the AUC for walking performance in the SS, PS, and NPS, respectively, of 0.81, 0.82, and 0.74.28 The study showed moderate accuracy for all muscle knee extension strength analyses models, but the authors did not evaluate the DS.28 The present study calculated the AUC for the SS, DS, PS, and NPS, but the PS and NPS presented no significant differences. Hence, only the models combining both sides (i.e., SS and DS) demonstrated significant and moderate accuracy to identify walking performance. But, the DS is limited because differences of the same magnitude do not necessarily represent the same level of strength for two individuals. Hence, this difference can be biased. Therefore, our findings suggest that the adoption of muscle knee extension strength analysis models combining the two sides (such as SS and DS), especially the SS, might be useful to assess rehabilitation interventions, in which walking performance is the outcome of interest.40
The highest percentile for the CWS test presenting statistical significance on the ROC curve was 0.50 m/s (with a cut-off point of −12.8 Nm/kg on the DS). These findings demonstrate the concentric PT of knee extensors on the PS, relative to the NPS, required by individuals with stroke to reach high walking performance. The cut-off point of 0.50 m/s in the CWS is relevant because this velocity represents the initial phase of a community walking capacity in individuals with stroke.41 From a practical standpoint, the present study demonstrated that for individuals with stroke to be considered limited community ambulators, it would be necessary to attain a peak torque on the PS of around 12.8 Nm/kg lower than the peak torque in the NPS. Previous studies demonstrated the importance of muscle strength on the PS concerning walking performance,4–8 however, the present study presented novel findings on how much strength is required on the PS compared to the NPS, to establish an optimal performance.
The SS cut-off point for the 75thpercentile for the 6MWT (324.6 m) was 2.1 Nm/kg. A previous study presented an SS cut-off point of 1.31 Nm/kg; however, the authors used a gait score of functional independence measure (FIM), which might explain this discrepancy.28 In contrast, the present study adopted a specific performance value provided by the 6MWT (324 m). The distance of 324 m on the 6MWT is sufficient to reach the unlimited community ambulator classification, representing independence in home and community activities.42 Thus, the SS needs to be twice as high as the body weight to achieve this category, in which individuals with stroke are not confined to their homes and have unlimited ability to walk in their community. The present study recommends using this information to assess the lower limb strength and ascertain the strength necessary to perform better on the 6WMT.
For the MWS, none of the AUCs in the different percentiles of PS, NPS, DS, and SS were significant. This might be explained by a limited association between strength and gait velocity.43 For instance, the rate of torque development44 was a predictor of higher walking velocity compared to the PT.45 This makes sense because the strength demands of several functional skills, including walking, are far from maximal, while for the MWS there is probably a demand for power rather than strength, so the AUCs were not significant. This demonstrates that the ability to generate torque within a physiologically meaningful time window is rather important.45 Thus, the present study assumes that the measurement of temporal constraints may be more relevant than an attainable PT value in an unconstrained time window. The present study assumes that the rate of torque development of other muscle groups, such as the plantar flexors, might be strongly associated with gait velocity, compared with the knee extensor muscles.46 Therefore, regardless of the strength analysis model, our findings suggest that PT is limited as a predictor of walking velocity.
Some limitations should be acknowledged. First, although our sample was composed of male and female participants, the present study did not include sex as a dependent variable. Second, during gait, the hip flexor and plantar flexor muscles are prime movers, mostly during the swing phase in individuals with stroke.47 However, as the present study assessed the quadriceps muscle, this aspect might have limited our findings. Third, although the present study performed an appropriate sample size calculation, caution should be used as any studies with human participants might be limited to detect small effect sizes. Moreover, the adoption of other outcomes related to muscle strength and walking performance, such as the rate of torque development, might be more suitable compared to PT measurements in this population.
ConclusionOur findings demonstrated that models of muscle knee extension strength analysis using the sum of the strength and the difference in strength between lower extremities presented moderate accuracy to identify walking performance in individuals with chronic stroke. These findings might be useful for selecting outcomes before strength training or rehabilitation programs in individuals with chronic stroke.
Conflicts of interestThe authors declare no conflict of interest.
Funded in part by the Universidade de Brasília (UnB), Master and PhD Program in Physical Education (PPGEF/UnB), and by the Coordenação de Aperfeiçoamento de Pessoal de Nível Superior - Brasil (CAPES; Finance Code 001). The funding source has no involvement in the study design; in the collection, analysis and interpretation of data; in the writing of the report; and in the decision to submit the article for publication.


