
Statistical analysis plans increase the transparency of decisions made in the analysis of clinical trial results. The purpose of this paper is to detail the planned analyses for the PREVENT trial, a randomized, placebo-controlled trial of patient education for acute low back pain.
ResultsWe report the pre-specified principles, methods, and procedures to be adhered to in the main analysis of the PREVENT trial data. The primary outcome analysis will be based on Mixed Models for Repeated Measures (MMRM), which can test treatment effects at specific time points, and the assumptions of this analysis are outlined. We also outline the treatment of secondary outcomes and planned sensitivity analyses. We provide decisions regarding the treatment of missing data, handling of descriptive and process measure data, and blinded review procedures.
ConclusionsMaking public the pre-specified statistical analysis plan for the PREVENT trial minimizes the potential for bias in the analysis of trial data, and in the interpretation and reporting of trial results.
Trial registrationACTRN12612001180808 (https://www.anzctr.org.au/Trial/Registration/TrialReview.aspx?ACTRN=12612001180808)
Low back pain is the most burdensome health problem worldwide1 and one that is seen commonly in primary care.2 People with low back pain who seek healthcare place high-value on receiving information and education about the problem.3 Indeed, all clinical guidelines endorse patient education in primary care.4 There is good evidence that primary care-based patient education, both face-to-face and written format, reduces emotional distress and subsequent healthcare use for acute low back pain.5
Despite widespread recommendations, few practitioners provide patient education in practice.6 One reason for lack of uptake could be the belief that conservative treatments such as patient education do not primarily change pain.7 For patients with chronic low back pain there is good evidence that this belief is mistaken.8 For patients with acute low back pain, however, evidence that patient education alone can reduce pain is lacking.9 Furthermore, no study has subjected face-to-face patient education to the gold standard placebo controlled trial, to control for the effects of spending time with a professional.
The PREVENT Trial10 was the first randomized, placebo-controlled trial of face-to-face patient education for acute low back pain. The purpose of this Statistical Analysis Plan is to outline planned statistical analysis methods for the primary and secondary outcomes of the trial.
Trial overviewThe trial is a two-arm placebo-controlled trial. Patients were randomized to receive two, 1-h sessions of Patient Education based on Explain Pain11 or two, 1-h sessions of Sham Education based on a reflective, non-directive approach,12 in addition to guideline-based care for acute low back pain. The PREVENT Trial was funded by the National Health and Medical Research Council of Australia (NHMRC APP1047827). It was prospectively registered (ACTRN=12612001180808) and the study protocol has been published elsewhere.10 Patients were followed up at 3, 6, and 12 months post-randomization.
Trial objectivesPrimary objectiveDetermine whether Patient Education in addition to clinical guideline-based care for acute low back pain reduces the intensity of low back pain at 3 months compared to Sham Education in addition to clinical guideline-based care.
Secondary objectivesDetermine whether any effect of Patient Education on the intensity of low back pain at 3 months compared the Sham Education can be maintained at 6 and 12 months.
Determine whether Patient Education increases the proportion of patients who recover from low back pain (i.e. who do not develop chronic low back pain) by 3 months compared to Sham Education.
Determine whether Patient Education can reduce disability, depression, pain attitudes, or healthcare use at 3, 6 and 12 months, compared to Sham Education.
Statistical analysisGeneral principlesTwo researchers blind to group allocation will perform the analysis independently. That is, the researcher will know which participants share a group, but not which group that is. All results will be cross-checked for errors. In cases where participants did not receive the treatment as allocated, treatment evaluation will be based on the principle of intention-to-treat. In other words, the analysis will only include observed responses from participants in the trial arm they were allocated to, regardless of whether they complied with the treatment and even if the last observed response was baseline. We will calculate and interpret between group differences and 95% confidence intervals for all outcomes. Statistical tests will be two-tailed with alpha set at p=<0.05.
Process measuresAdherenceWe recorded attendance for all participants at both trial sessions using a study calendar. We will use these data to assess whether the proportion of participants who successfully completed both trial sessions was different between trial arms. If >5% of participants do not complete both trial sessions, we will compute a “Complier Average Causal Effect”.13
Treatment fidelityWe assessed treatment fidelity by audio recording the trial sessions. Two researchers, experts in Patient Education (LM) and Sham Education (MN) who are blinded to group allocation, will evaluate a random 10% sample of the trial session recordings to determine whether the participant was receiving Patient Education or Sham Education. Kappa will be used to determine agreement.
CredibilityWe assessed credibility using the Credibility and Expectancy Questionnaire14 immediately after the trial physical therapist provided the treatment rationale. We will compare the between group mean scores of the Credibility and Expectancy Questionnaire using t test to evaluate whether treatment credibility was different in each trial arm.
Blind review of data integrity and handlingAll data were collected using online forms. Because the online data collection system required only minimal handling, data will be checked but not double entered as we originally planned and as stated in our protocol.10 To ensure data integrity, a blind assessor will check each variable for out of range or implausible values. Once all data have been checked, we will import the dataset in panel format, into Stata V13.15
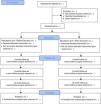
Participant recruitment and retentionA flow chart describing the numbers of individuals at each stage of the trial from eligibility to final assessment will be reported, according to the CONSORT statements16 (see Fig. 1).
Baseline description
We will examine the distribution of all baseline variables stratified by treatment group. Continuous variables will be summarized using the following statistics: number (non-missing sample size), mean and standard deviation for approximately normally distributed variables; median, minimum, maximum and interquartile range for non-normally distributed variables. Normality will be evaluated using frequency histogram and skewness statistics. The number of missing observations will also be reported. Categorical variables will be summarized by percentages along with their frequencies (numerator) and the number of patients for whom data are available (denominator). Difference between arms will not be tested statistically, but any important imbalance, based on the judgment of the research team, will be mentioned and will be marked with an asterisk (*).
Primary analysisWe calculated that a sample size of 202 participants would provide an 80% power of detecting a mean difference between trial arms of one-point on a 10-point pain intensity scale assuming a standard deviation of 2.3, an α of .05, and allowing 15% loss to follow-up.10 To determine the effect of Patient Education on pain intensity we will use longitudinal mixed models.17 In longitudinal studies such as randomized trials, mixed models can produce unbiased estimates of treatment effects. A mixed model contains both fixed and random effects. In this analysis, the intervention will be modeled as a fixed effect and, to account for the dependence of repeated measures, the intercepts will be modeled as random effect (Eq. (1)). We will use an unstructured correlation matrix to specify the model. Our expectation is that the outcome of pain intensity will be normally distributed. Time will be treated as a dummy-coded categorical variable and we will examine group×time interactions to determine treatment effects. Conclusions about the effectiveness of Patient Education will be based on the group×time interaction effect and its 95% confidence interval at 3 months.
Eq. (1) – Mixed Model for Repeated Measures (MMRM) regression equation for the primary analysis (based on Ashbeck and Bell)18:
where Yij is the outcome for the ith participant at the jth time, i=1,…,n=202, j=1, 2, 3, 4, t1 is indicator variable for time 1 (baseline), t2 for time 2 (3 months), t3 for time 3 (6 months), t4 for time 4 (12 months), treati=0 (control), treati=1 (treatment). The effects of the treatment and the treatment–time interaction are modeled as fixed effects.
βi=∼N(0, σb2) between-person effects, with σb2 between-person variance. The between-person effects are modeled as random effects. eij=∼N(0, σe2) within-person effects, with σe2 within-person variance.
Assumptions of the Mixed Model for Repeated Measures (MMRM) analysisThe mixed model analysis requires assumptions about the data. These include independence of observations, normality and heteroscedasticity. Missing data are assumed to be Missing at Random. Missing at Random describes the probability of a missing observation being independent of prior observations but conditional on other observed values. MMRM analyses also assume a correlation structure between the repeated measurements. The correlations can be fixed (structured model), decaying (autoregressive model) or unconstrained (unstructured model). We have assumed unconstrained correlations between the repeated assessments.
Secondary analysisPersistence of effects on pain and disabilityTo evaluate the effects of Patient Education on pain intensity at 6 and 12 months, we will examine the relevant group×time interactions from the longitudinal mixed model used for the primary analysis. We will build a separate model to examine intervention effects on disability at 3, 6 and 12 months. We will specify the disability model in the same way as in the primary analysis (Eq. (1)), exchanging the Y outcome variable to disability measured on a continuous scale (Roland Morris Disability Questionnaire).19
Development of chronic low back painTo assess the number of participants who transition from acute low back pain to chronic low back pain we will categorize participants according to our definition of chronic low back pain: ≥2/10 pain intensity and no periods of recovery at 3 month follow-up.10 To evaluate the effects of Patient Education on the development of chronic low back pain, we will estimate the ratio of the odds of having chronic low back pain using a Generalized Mixed Effects Model with a logit link and a random intercept. The model will provide odds ratio between the two arms of experiencing a transition from acute to chronic low back pain.
Short- and long-term effects on pain, disability, depression, pain attitudes and healthcare useWe will undertake exploratory analyses on all secondary outcomes. To test intervention effects on continuous secondary outcomes (disability, depression, pain, global change, pain attitudes and healthcare visits) we will examine group×time interactions from the longitudinal mixed models at each follow-up time point.
Four secondary outcomes were categorical variables: healthcare use (passive modalities, e.g. medication, manual therapy vs active modalities, e.g. exercise, rehabilitation); choice of practitioner; recurrence; further investigations required. For the outcomes with two categories we will use logistic regression models to determine between group differences. For the outcome with four categories (choice of practitioner), we will use a multinomial logistic regression.
Sensitivity analysisOut-of-trial therapyWe will evaluate the effect of out-of-trial therapy (number of healthcare visits) as a post-randomization confounder. The purpose of this sensitivity analysis is to assess the influence of Sham Education, which may have unintentionally led participants to seek out-of-trial therapy. We will conduct a mediation analysis to estimate the natural direct effect20 of Patient Education on pain intensity at 3 months that eliminates the indirect effect of Sham Education on pain intensity through out-of-trial therapy.
Reporting dataContinuous outcomes (e.g. low back pain intensity scale) will be summarized by number of data available, mean and standard deviation at each data collection point (Baseline, 3, 6 and 12 months). We will display the treatment effect, estimated as the mean pain intensity scale difference at each time point, along with the corresponding 95% confidence interval and the level of significance. Categorical variables will appear as frequencies and percentages at each time point. We will report overall odds ratios (95% confidence interval) and the level of significance.
ContributionsThe original study was conceived and designed by ACT, GLM, MH, HL, IWS, NH, JMH, KMR, FMB, CJM, GP, and JHM. The analysis plan was developed by JHM, ACT, MH, HL, SL, and IWS. ACT prepared the first draft of the manuscript. Successive drafts were contributed by ACT, GLM, MH, HL, IWS, NH, JMH, KMR, FMB, CJM, SL and JHM. The final version of the manuscript was approved by all authors.
Conflicts of interestThe authors declare no conflicts of interest.


