Low back pain (LBP) is little explored in the aging population especially when considering age-relevant and culturally dependent outcomes. We aimed to describe socio-demographic and clinical characteristics of Brazilian older people with a new episode of LBP presenting to primary care.
MethodsWe sourced baseline information on socio-demographic, pain-related and clinical characteristics from 602 older adults from the Brazilian Back Complaints in the Elders (Brazilian BACE) study. We analyzed differences in pain, disability, functional capacity and psychosocial factors between sub-groups based on age (i.e. participants aged 55–74 or ≥75 years), education (i.e. those with four years or less of schooling or those with more than four years of schooling) and income (i.e. participants who reported earning two or less minimal wages or three and more).
ResultsParticipants presented severe LBP (7.18/10, SD: 2.59). Younger participants were slightly more disabled (mean difference 1.29 points, 95% confidence interval [CI]: 0.03/5.56), reporting poorer physical health, and less fall-related self-efficacy (mean difference of 2.41, 95% CI 0.35/4.46). Those less educated, and those with income equal or less than two minimum wages had more disability, pain catastrophizing and worse functional capacity.
ConclusionsThis was the first study showing that Brazilian older adults with LBP present high levels of functional disability and psychological distress, especially those with low socioeconomic status.
Low back pain (LBP) is ranked as the top condition contributing to years lived with disability (YLD) globally.1 In Brazil, back complaints were the second most commonly reported health condition in 2003 and 20082 and the third cause for early retirement due to disability in 2007, bringing a high demand for health care services in older people.3,4 While both the prevalence and the associated burden of LBP in terms of disability increase with age,1 information about LBP in the older adults is very limited, and the majority of studies on LBP exclude these patients. Considering the fast growth of the aging population in developing countries, and the influence of socioeconomic context in many health outcomes, addressing LBP in this population is crucial. To date, there is no data available on LBP in older people from Latin America.
In the present study, we explored variables related to pain and disability in Brazilian older patients using the Brazilian baseline data collected for the Back Complaints in the Elder (BACE) international consortium, which was established by Australia, Brazil and the Netherlands to investigate the burden of back complaints in the older adult.5,6 Thus, the aim of this study was to describe the clinical characteristics of Brazilians aged 55 or more with an acute episode of LBP. Moreover, we also aimed to: (i) compare if these characteristics differ between different groups of age (55–74 years; 75 and over) and (ii) compare if pain and functional capacity related characteristics differ between groups of educational level and income status.
MethodsStudy design and participantsThe BACE protocol has been published in detail elsewhere.5 This study examined the Brazilian Back Complaints in the Elders (Brazilian BACE) cohort study data (ethics 0100.0.203.000-11, Ethics Committee of Universidade Federal de Minas Gerais (UFMG), Belo Horizonte, MG, Brazil), which consists of patients with LBP, defined as pain in the area between the inferior margin of the ribs and the gluteal crease. To be included, participants needed to present with a new episode of pain, i.e. not seeking care for LBP in the preceding six months of recruitment and having an acute episode of LBP lasting six weeks or less. Participants were excluded if presenting any severe visual, motor or hearing loss, or cognitive dysfunctions7 that prevented them from being assessed.
Physicians or allied health care professionals at primary care or health centers specialized in geriatrics from either public or private healthcare systems in Brazil invited participants identified with LBP to contact the Brazilian BACE research team, who screened participants for eligibility. All participants signed the informed consent form.
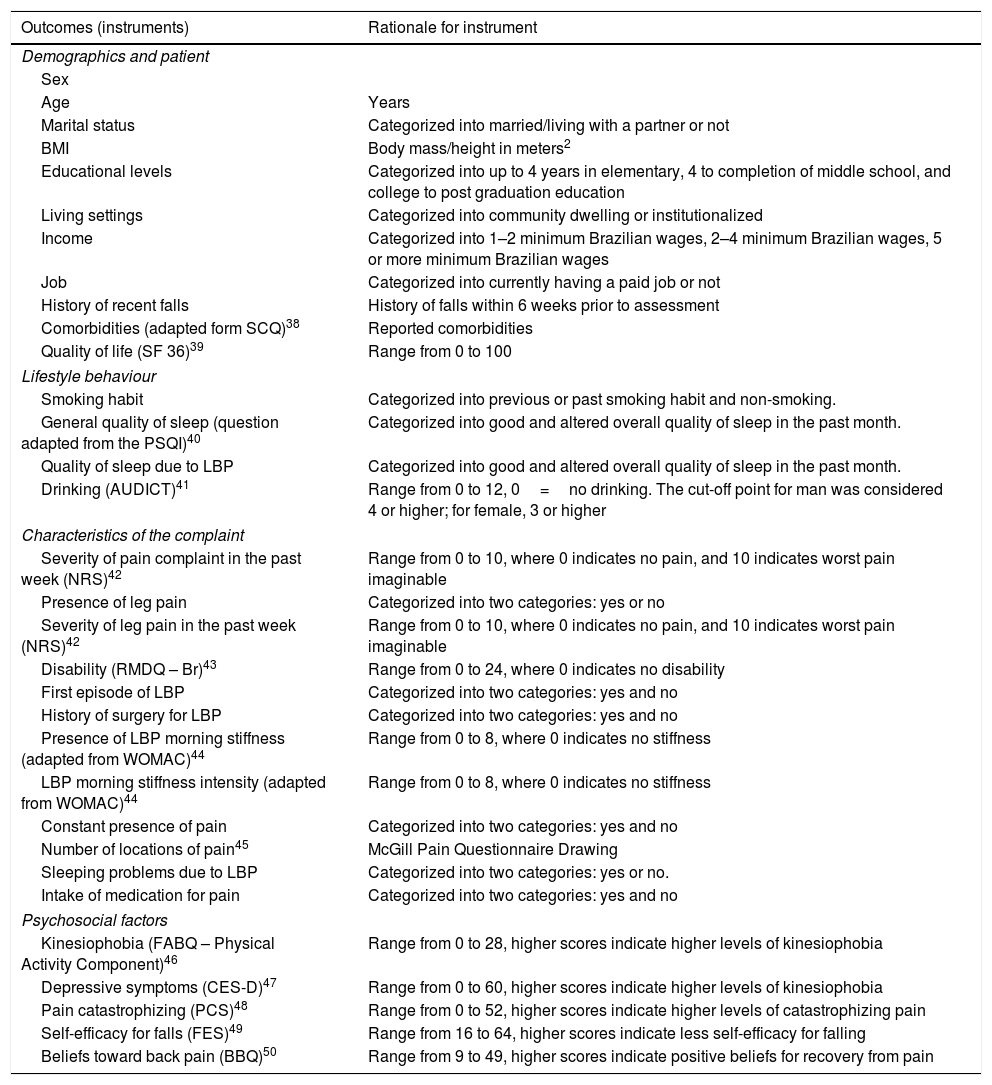
Data collectionWe divided baseline data collection into two stages. The first stage consisted of a structured interview with history taking and questionnaires. The second stage consisted of physical examination. The interview included questions on (i) demographic and patient characteristics, (ii) lifestyle behavior, (iii) symptoms’ characteristics, (iv) psychological factors, and (v) comorbidities. To accommodate for the requirements in text limit a more comprehensive description is provided in Table 1.
Contents of the Brazilian BACE interview.
| Outcomes (instruments) | Rationale for instrument |
|---|---|
| Demographics and patient | |
| Sex | |
| Age | Years |
| Marital status | Categorized into married/living with a partner or not |
| BMI | Body mass/height in meters2 |
| Educational levels | Categorized into up to 4 years in elementary, 4 to completion of middle school, and college to post graduation education |
| Living settings | Categorized into community dwelling or institutionalized |
| Income | Categorized into 1–2 minimum Brazilian wages, 2–4 minimum Brazilian wages, 5 or more minimum Brazilian wages |
| Job | Categorized into currently having a paid job or not |
| History of recent falls | History of falls within 6 weeks prior to assessment |
| Comorbidities (adapted form SCQ)38 | Reported comorbidities |
| Quality of life (SF 36)39 | Range from 0 to 100 |
| Lifestyle behaviour | |
| Smoking habit | Categorized into previous or past smoking habit and non-smoking. |
| General quality of sleep (question adapted from the PSQI)40 | Categorized into good and altered overall quality of sleep in the past month. |
| Quality of sleep due to LBP | Categorized into good and altered overall quality of sleep in the past month. |
| Drinking (AUDICT)41 | Range from 0 to 12, 0=no drinking. The cut-off point for man was considered 4 or higher; for female, 3 or higher |
| Characteristics of the complaint | |
| Severity of pain complaint in the past week (NRS)42 | Range from 0 to 10, where 0 indicates no pain, and 10 indicates worst pain imaginable |
| Presence of leg pain | Categorized into two categories: yes or no |
| Severity of leg pain in the past week (NRS)42 | Range from 0 to 10, where 0 indicates no pain, and 10 indicates worst pain imaginable |
| Disability (RMDQ – Br)43 | Range from 0 to 24, where 0 indicates no disability |
| First episode of LBP | Categorized into two categories: yes and no |
| History of surgery for LBP | Categorized into two categories: yes and no |
| Presence of LBP morning stiffness (adapted from WOMAC)44 | Range from 0 to 8, where 0 indicates no stiffness |
| LBP morning stiffness intensity (adapted from WOMAC)44 | Range from 0 to 8, where 0 indicates no stiffness |
| Constant presence of pain | Categorized into two categories: yes and no |
| Number of locations of pain45 | McGill Pain Questionnaire Drawing |
| Sleeping problems due to LBP | Categorized into two categories: yes or no. |
| Intake of medication for pain | Categorized into two categories: yes and no |
| Psychosocial factors | |
| Kinesiophobia (FABQ – Physical Activity Component)46 | Range from 0 to 28, higher scores indicate higher levels of kinesiophobia |
| Depressive symptoms (CES-D)47 | Range from 0 to 60, higher scores indicate higher levels of kinesiophobia |
| Pain catastrophizing (PCS)48 | Range from 0 to 52, higher scores indicate higher levels of catastrophizing pain |
| Self-efficacy for falls (FES)49 | Range from 16 to 64, higher scores indicate less self-efficacy for falling |
| Beliefs toward back pain (BBQ)50 | Range from 9 to 49, higher scores indicate positive beliefs for recovery from pain |
AUDIT-C, alcohol use disorders identification test; BBQ, Back Beliefs Questionnaire; CES-D, Center for Epidemiologic Studies Depression Scale; FABQ_A, Fear Avoidance Beliefs Questionnaire; FES, Falls Efficacy Scale; NRS, Numeric Rating Scale; PCS, Pain Catastrophization Scale; PSQI, Pittsburg Sleep Quality Index; RMDQ-Br, Roland Morris Disability Questionnaire – Brasil; SCQ, Self-administered Comorbidity Questionnaire; SF 36, Short Form (36) Health Survey.
The physical examination included assessing trunk mobility, measured by finger-to-floor distance test; gait speed measured during a 4.6m route, then converted to total meters per second (m/s); the Timed Up and Go (TUG) test8 measured in seconds (s); the dominant handgrip strength in kg/F, using a manual handheld dynamometer (SAEHAN Hydraulic Hand Dynamometer, SH5001 – 973, 8 KOREA).
Data analysisWe reported characteristics of the sample with descriptive statistics, including mean, median, interquartile (IQ), standard deviation (SD), and confidence interval (CI). We conducted subgroup analyses based on age, 55–74 years, and ≥75 years. We performed the Levene test prior to comparisons, and used a p-value equal or greater than 0.05 to assume equality of variances between groups. We conducted the Chi square test to compare frequencies between subgroups, and the independent T test or Mann–Whitney-U test for continuous outcomes.
Additionally, we analyzed subgroups based on income and educational level status according to Brazilian national information on the topic for the aging population. For income status, subgroups were as following: (i) low income (i.e. up to two minimum Brazilian wages); (ii) medium and high income (i.e. three or more minimum Brazilian wages). The selection of subgroups for educational levels were: (i) low educational level (i.e. from illiteracy up to four years of education in elementary school); (ii) medium and high levels of education (i.e. five or more years of education). For both of these comparisons, we included analyses on severity of LBP in the past week, presence of leg pain, severity of leg pain in the past week, disability, TUG test and pain catastrophizing. We selected these variables a priori based on the literature for LBP main outcomes and related psychological factors, and in the biological measurement used in both BACE cohorts that is a gold reference for functional mobility in the elderly. We carried out the analyses using SPSS version 22.0 (SPSS Inc., Chicago, IL, USA), significance level at p>0.05.
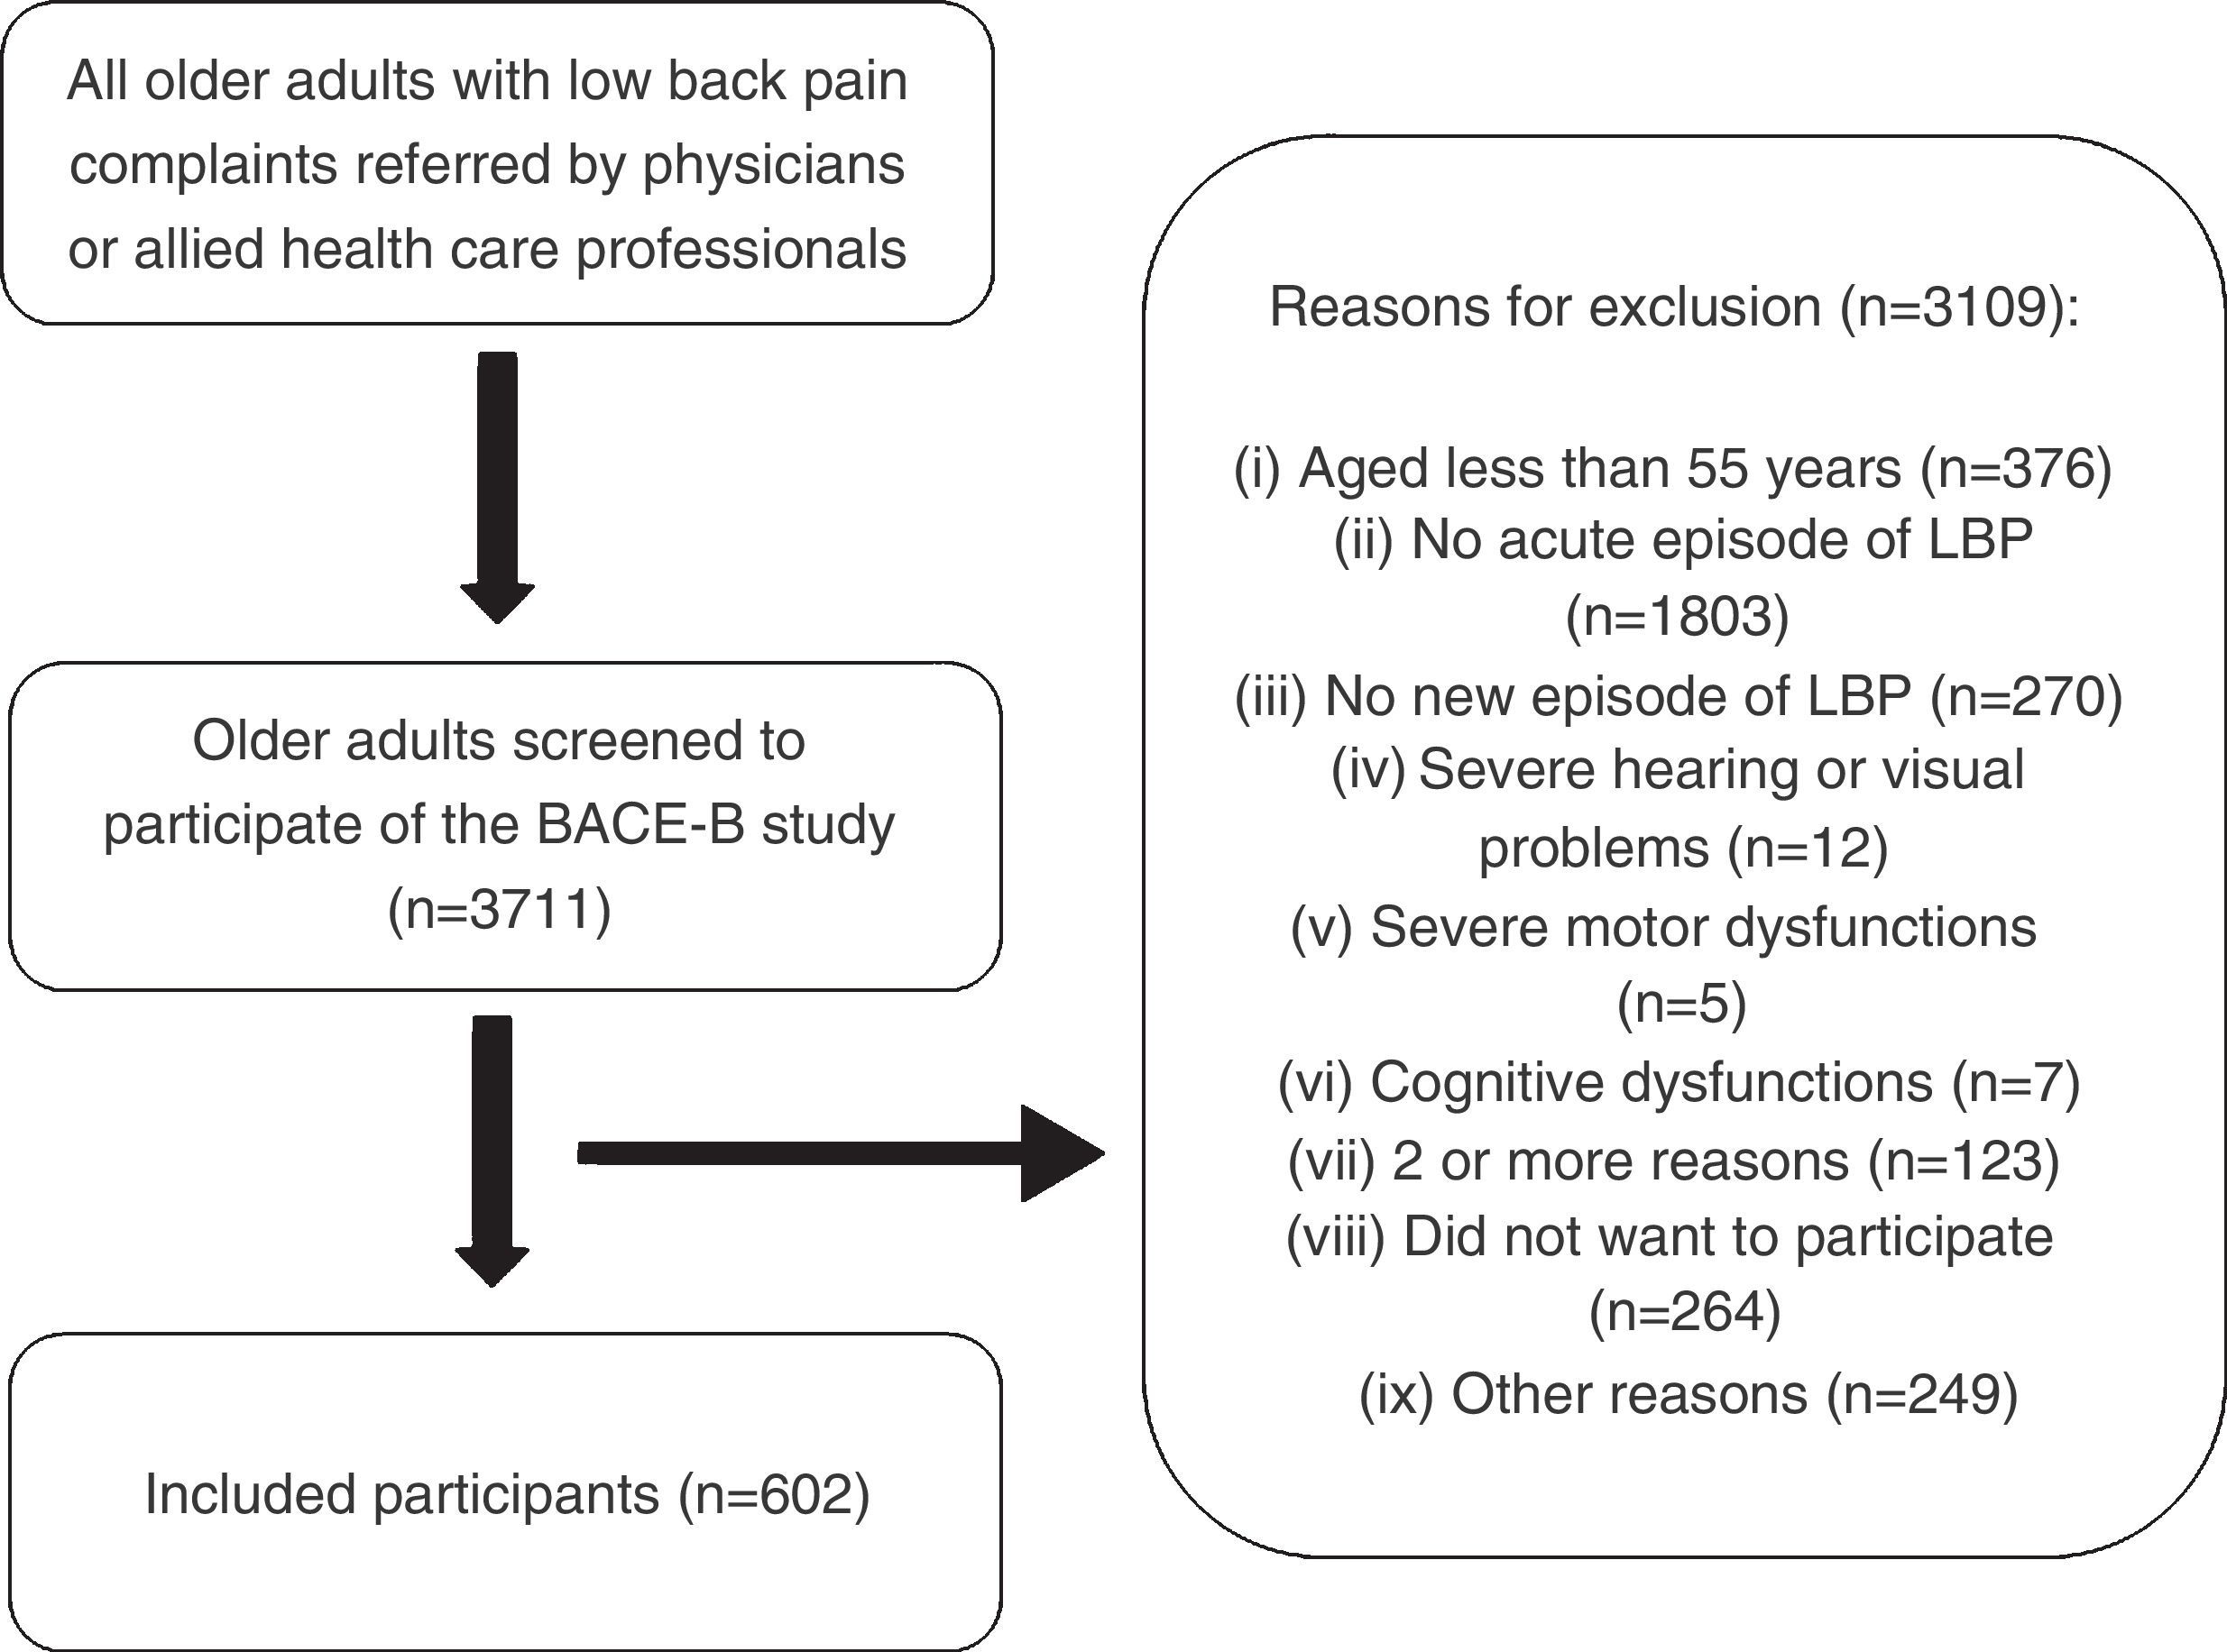
ResultsThe research team screened 3711 older adults to participate in the Brazilian BACE study, later resulting in the inclusion of 602 participants (Fig. 1). Physicians directly referred 7.1% of participants, whereas allied health professionals referred the remaining participants. The median age of all 602 participants was 67 (IQ=10), and median duration of pain in days from the acute pain episode was 15 days (IQ=23). Approximately 85% of the participants were female, 40% reported having low income, and the majority had low levels of education. Almost 50% of participants were either married or had a partner, 99% were community dwellers, and 19% had a recent history of falls.
Age group comparisonsPatient characteristics (55–74 years or 75 years or older)
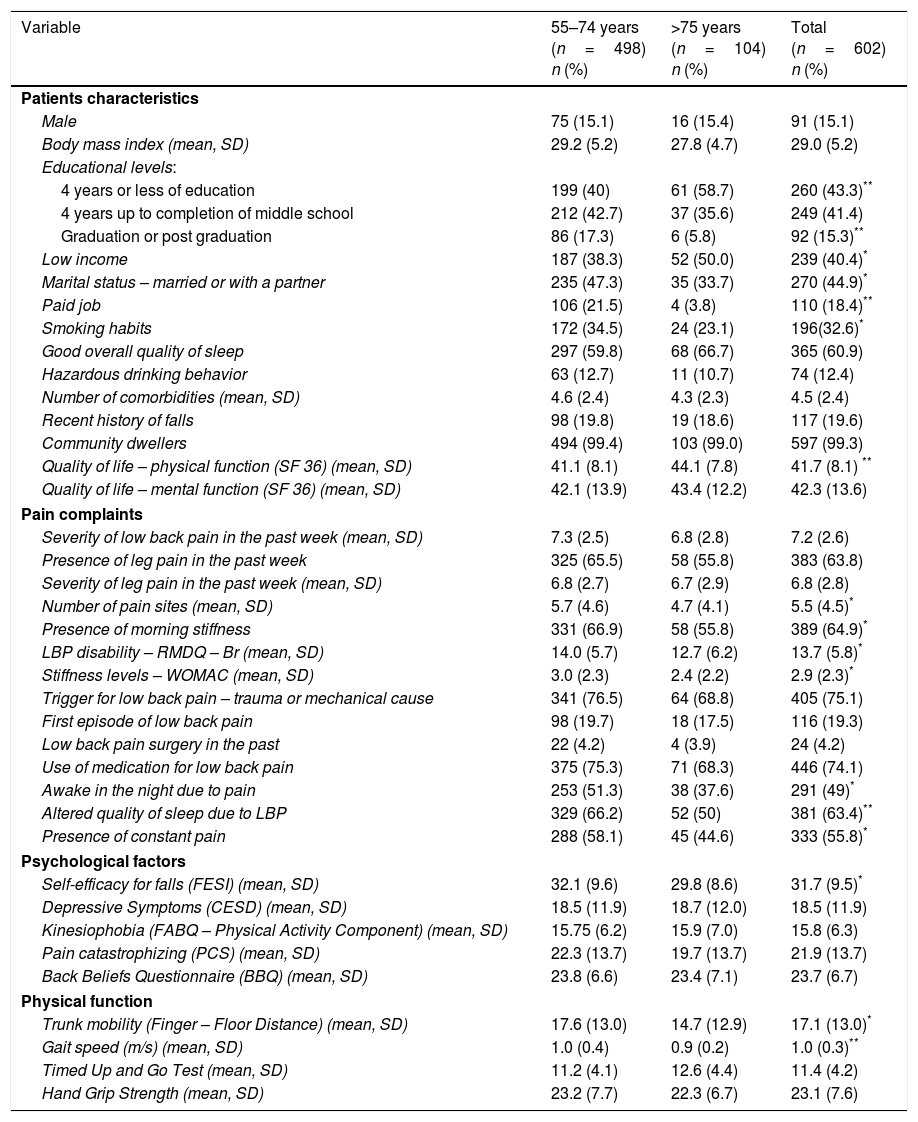
More participants from the older participants’ group reported low levels of both income and education compared to the younger group (Table 2). The younger group had significant higher BMI levels, and fewer of them were either married or lived with a partner, compared to the older group. More participants from the younger group had paid jobs (21.5% vs. 3.8%), and more of them had either current or past history of smoking; we observed a similar frequency of hazardous drinking in both groups of age.
Baseline characteristics – comparison between groups of age and characteristics of total sample from Brazilian BACE (n=602).
| Variable | 55–74 years (n=498) n (%) | >75 years (n=104) n (%) | Total (n=602) n (%) |
|---|---|---|---|
| Patients characteristics | |||
| Male | 75 (15.1) | 16 (15.4) | 91 (15.1) |
| Body mass index (mean, SD) | 29.2 (5.2) | 27.8 (4.7) | 29.0 (5.2) |
| Educational levels: | |||
| 4 years or less of education | 199 (40) | 61 (58.7) | 260 (43.3)** |
| 4 years up to completion of middle school | 212 (42.7) | 37 (35.6) | 249 (41.4) |
| Graduation or post graduation | 86 (17.3) | 6 (5.8) | 92 (15.3)** |
| Low income | 187 (38.3) | 52 (50.0) | 239 (40.4)* |
| Marital status – married or with a partner | 235 (47.3) | 35 (33.7) | 270 (44.9)* |
| Paid job | 106 (21.5) | 4 (3.8) | 110 (18.4)** |
| Smoking habits | 172 (34.5) | 24 (23.1) | 196(32.6)* |
| Good overall quality of sleep | 297 (59.8) | 68 (66.7) | 365 (60.9) |
| Hazardous drinking behavior | 63 (12.7) | 11 (10.7) | 74 (12.4) |
| Number of comorbidities (mean, SD) | 4.6 (2.4) | 4.3 (2.3) | 4.5 (2.4) |
| Recent history of falls | 98 (19.8) | 19 (18.6) | 117 (19.6) |
| Community dwellers | 494 (99.4) | 103 (99.0) | 597 (99.3) |
| Quality of life – physical function (SF 36) (mean, SD) | 41.1 (8.1) | 44.1 (7.8) | 41.7 (8.1) ** |
| Quality of life – mental function (SF 36) (mean, SD) | 42.1 (13.9) | 43.4 (12.2) | 42.3 (13.6) |
| Pain complaints | |||
| Severity of low back pain in the past week (mean, SD) | 7.3 (2.5) | 6.8 (2.8) | 7.2 (2.6) |
| Presence of leg pain in the past week | 325 (65.5) | 58 (55.8) | 383 (63.8) |
| Severity of leg pain in the past week (mean, SD) | 6.8 (2.7) | 6.7 (2.9) | 6.8 (2.8) |
| Number of pain sites (mean, SD) | 5.7 (4.6) | 4.7 (4.1) | 5.5 (4.5)* |
| Presence of morning stiffness | 331 (66.9) | 58 (55.8) | 389 (64.9)* |
| LBP disability – RMDQ – Br (mean, SD) | 14.0 (5.7) | 12.7 (6.2) | 13.7 (5.8)* |
| Stiffness levels – WOMAC (mean, SD) | 3.0 (2.3) | 2.4 (2.2) | 2.9 (2.3)* |
| Trigger for low back pain – trauma or mechanical cause | 341 (76.5) | 64 (68.8) | 405 (75.1) |
| First episode of low back pain | 98 (19.7) | 18 (17.5) | 116 (19.3) |
| Low back pain surgery in the past | 22 (4.2) | 4 (3.9) | 24 (4.2) |
| Use of medication for low back pain | 375 (75.3) | 71 (68.3) | 446 (74.1) |
| Awake in the night due to pain | 253 (51.3) | 38 (37.6) | 291 (49)* |
| Altered quality of sleep due to LBP | 329 (66.2) | 52 (50) | 381 (63.4)** |
| Presence of constant pain | 288 (58.1) | 45 (44.6) | 333 (55.8)* |
| Psychological factors | |||
| Self-efficacy for falls (FESI) (mean, SD) | 32.1 (9.6) | 29.8 (8.6) | 31.7 (9.5)* |
| Depressive Symptoms (CESD) (mean, SD) | 18.5 (11.9) | 18.7 (12.0) | 18.5 (11.9) |
| Kinesiophobia (FABQ – Physical Activity Component) (mean, SD) | 15.75 (6.2) | 15.9 (7.0) | 15.8 (6.3) |
| Pain catastrophizing (PCS) (mean, SD) | 22.3 (13.7) | 19.7 (13.7) | 21.9 (13.7) |
| Back Beliefs Questionnaire (BBQ) (mean, SD) | 23.8 (6.6) | 23.4 (7.1) | 23.7 (6.7) |
| Physical function | |||
| Trunk mobility (Finger – Floor Distance) (mean, SD) | 17.6 (13.0) | 14.7 (12.9) | 17.1 (13.0)* |
| Gait speed (m/s) (mean, SD) | 1.0 (0.4) | 0.9 (0.2) | 1.0 (0.3)** |
| Timed Up and Go Test (mean, SD) | 11.2 (4.1) | 12.6 (4.4) | 11.4 (4.2) |
| Hand Grip Strength (mean, SD) | 23.2 (7.7) | 22.3 (6.7) | 23.1 (7.6) |
AUDIT-C, alcohol use disorders identification test; BBQ, Back Beliefs Questionnaire; CES-D, Center for Epidemiologic Studies Depression Scale; FABQ_A, Fear Avoidance Beliefs Questionnaire; FESI, Falls Efficacy Scale International; NRS, Numeric Rating Scale; PCS, Pain Catastrophization Scale; PSQI, Pittsburg Sleep Quality Index; RMDQ-Br, Roland Morris Disability Questionnaire – Brasil; SCQ, Self-administered Comorbidity Questionnaire; SF 36, Short Form (36) Health Survey.
The number of pain locations reported by participants was greater in the younger group, compared to the older group (mean difference of 1.0; 95% CI 0.4–1.9). Similarly, participants from the younger group referred more constant pain during the day (58.1% vs. 44.6%) and sleep disruption due to pain (51.3% vs. 37.6%). Disability was slightly higher in the younger group (mean difference of 1.3; 95% CI 0.03–5.6). LBP stiffness was higher in frequency in the younger group (66.9% vs. 55.8%), and stiffness intensity was greater in that group as well (mean difference of 0.6; 95% CI 0.4–1.1). The only significant difference observed for psychosocial was on the Falls related Efficacy Scale – International scores, in which younger participants had less self-efficacy for falls compared to the older group (mean difference of 2.4, 95% CI 0.4–4.5).
Physical examination comparison between groups of ageWhen compared to the older group, participants from the younger group took less time to complete the TUG test (mean difference of −1.43s, 95% CI −2.3 to −0.6). Gait speed values revealed that younger people took less time to complete the determined route (mean difference between younger and older groups of −0.40s, 95% CI −0.8 to −0.03). In contrast, participants from the older group presented more trunk mobility assessed by the finger to floor mobility test (mean difference of 3.0; 95% CI 0.3–5.8).
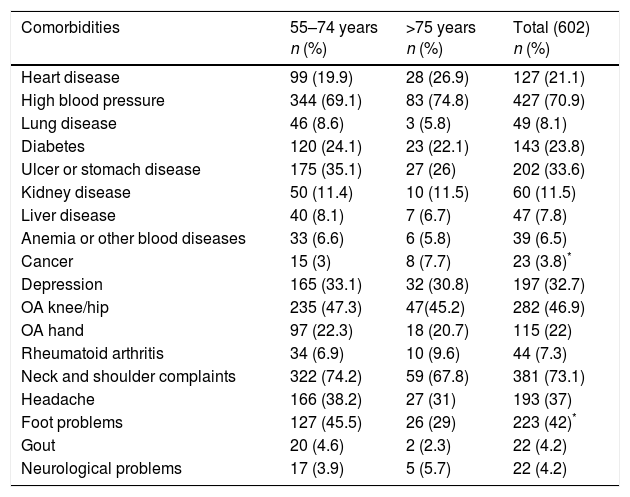
Self-reported comorbiditiesFor the whole cohort, the most prevalent self-reported comorbidities were neck and shoulder complaints (73.1%), hypertension (70.9%), followed by knee and or hip osteoarthritis (46.9%) (Table 3). The most frequently reported comorbidity in the older group was hypertension (74.8%), whereas in the younger group it was neck and shoulder complaints (74.2%). Participants from the older group had higher rates of cancer (7.7% vs. 3.0%), while participants from the younger group referred more foot problems (45.5% vs. 29.0%).
Self-reported comorbidities in Brazilian BACE participants.
| Comorbidities | 55–74 years n (%) | >75 years n (%) | Total (602) n (%) |
|---|---|---|---|
| Heart disease | 99 (19.9) | 28 (26.9) | 127 (21.1) |
| High blood pressure | 344 (69.1) | 83 (74.8) | 427 (70.9) |
| Lung disease | 46 (8.6) | 3 (5.8) | 49 (8.1) |
| Diabetes | 120 (24.1) | 23 (22.1) | 143 (23.8) |
| Ulcer or stomach disease | 175 (35.1) | 27 (26) | 202 (33.6) |
| Kidney disease | 50 (11.4) | 10 (11.5) | 60 (11.5) |
| Liver disease | 40 (8.1) | 7 (6.7) | 47 (7.8) |
| Anemia or other blood diseases | 33 (6.6) | 6 (5.8) | 39 (6.5) |
| Cancer | 15 (3) | 8 (7.7) | 23 (3.8)* |
| Depression | 165 (33.1) | 32 (30.8) | 197 (32.7) |
| OA knee/hip | 235 (47.3) | 47(45.2) | 282 (46.9) |
| OA hand | 97 (22.3) | 18 (20.7) | 115 (22) |
| Rheumatoid arthritis | 34 (6.9) | 10 (9.6) | 44 (7.3) |
| Neck and shoulder complaints | 322 (74.2) | 59 (67.8) | 381 (73.1) |
| Headache | 166 (38.2) | 27 (31) | 193 (37) |
| Foot problems | 127 (45.5) | 26 (29) | 223 (42)* |
| Gout | 20 (4.6) | 2 (2.3) | 22 (4.2) |
| Neurological problems | 17 (3.9) | 5 (5.7) | 22 (4.2) |
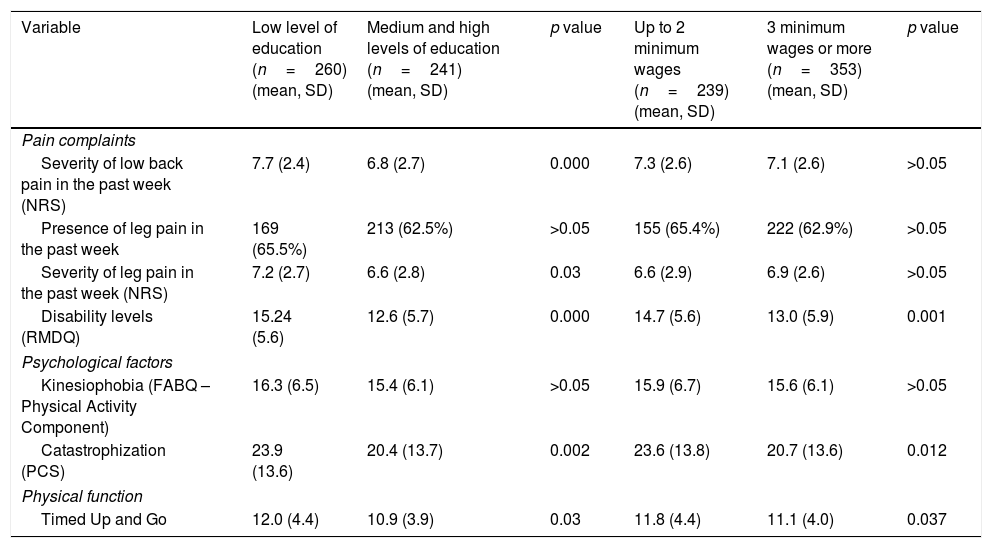
Participants with low levels of education had more severe LBP and leg pain levels compared to those more educated (mean difference of 0.85, 95% CI 0.4–1.3, and 0.61, 95% CI 0.1–1.2, respectively) (Table 4). Notably, they were more disabled (mean difference of 2.6; 95% CI 1.7–3.6), had more signs of pain catastrophizing (mean difference of 3.5; 95% CI 1.3–5.7), and took longer to complete the TUG test (mean difference of 1.0; 95% CI 0.4–1.7). Participants with low levels of income reported more disability (mean difference of 1.7; 95% CI 0.7–2.7), more pain catastrophizing (mean difference of 2.9; 95% CI 0.7–5.2) and took longer to complete the TUG test (mean difference of 0.7; 95% CI 0.04–1.4).
Baseline characteristics – comparison between participants with different educational levels and income status.
| Variable | Low level of education (n=260) (mean, SD) | Medium and high levels of education (n=241) (mean, SD) | p value | Up to 2 minimum wages (n=239) (mean, SD) | 3 minimum wages or more (n=353) (mean, SD) | p value |
|---|---|---|---|---|---|---|
| Pain complaints | ||||||
| Severity of low back pain in the past week (NRS) | 7.7 (2.4) | 6.8 (2.7) | 0.000 | 7.3 (2.6) | 7.1 (2.6) | >0.05 |
| Presence of leg pain in the past week | 169 (65.5%) | 213 (62.5%) | >0.05 | 155 (65.4%) | 222 (62.9%) | >0.05 |
| Severity of leg pain in the past week (NRS) | 7.2 (2.7) | 6.6 (2.8) | 0.03 | 6.6 (2.9) | 6.9 (2.6) | >0.05 |
| Disability levels (RMDQ) | 15.24 (5.6) | 12.6 (5.7) | 0.000 | 14.7 (5.6) | 13.0 (5.9) | 0.001 |
| Psychological factors | ||||||
| Kinesiophobia (FABQ – Physical Activity Component) | 16.3 (6.5) | 15.4 (6.1) | >0.05 | 15.9 (6.7) | 15.6 (6.1) | >0.05 |
| Catastrophization (PCS) | 23.9 (13.6) | 20.4 (13.7) | 0.002 | 23.6 (13.8) | 20.7 (13.6) | 0.012 |
| Physical function | ||||||
| Timed Up and Go | 12.0 (4.4) | 10.9 (3.9) | 0.03 | 11.8 (4.4) | 11.1 (4.0) | 0.037 |
NRS, Numeric Rating Scale; RMDQ-Br, Roland Morris Disability Questionnaire – Brazil; FABQ, Fear Avoidance Beliefs Questionnaire; PCS, Pain Catastrophizing Scale; FESI, Falls Efficacy Scale International.
*p<0.05.
**p<0.01.
This study presents the characteristics of 602 Brazilian older adults who suffered from a new episode of LBP. Our participants presented higher levels of pain, disability and psychological distress compared to international data.9,10 Present results demonstrate that age, educational levels, and income status appear to affect older people's report of pain, but even more of disability.
Results indicate that the relationship between LBP and disability is not linearly dependent on chronological aging. In contrast to the Dutch BACE findings,9 the younger group reporting slightly more pain-related disability than the older group, and worse quality of life related to physical function. We hypothesize that these differences could be due to some factors: younger adults were more active in the community, thus pain could have affected more significantly their daily functions; also, other factors influence pain and disability in the aged population, such as increased levels of inflammatory cytokines,11,12 sarcopenia,13,14 degenerative diseases, having poorer perception of health, psychosocial factors, and having more concurrent diseases.15–17 Additionally, these results might also lie in the peculiarity of the evolution of life expectancy in Brazil, which in 1940 was around 40 years old. Thus, Brazilians aged 75 and over from this study must have physical and functional characteristics that favored their survival over the years, thus being more resilient to their health condition.
We highlight the prevalence of falls in the sample, moreover the younger group having less self-efficacy for falls. A recent systematic review revealed that musculoskeletal pain is associated with an increased risk of falls in community-dwelling older adults (OR=1.56; 95% CI 1.36–1.79),18 thus LBP can also be associated with such events.19 In more active older adults, having reduced self-efficacy can be associated with some protective behavior in them triggered by falling, and this behavior could have a negative impact in function.20 Particularly comorbidities are also associated with the burden of pain whereas having other musculoskeletal conditions might negatively impact the lower back.21–25 Hence, we encourage understanding comorbidities in older patients with LBP, for they bring more complexity for LBP care. The older group had more participants with a history of cancer. Cancer is a red flag for LBP,26 and it might differently influence these groups in the course of the complaint, though this needs to be followed-up in the long term.
For aged people with LBP, limited evidence shows that LBP can be associated with poor performance of the TUG test14,22 and difficulty in performing daily life activities.27 In this study, those who were older, less educated, and with lower levels of income took longer to complete the TUG test. Also, while older participants had lower gait speed, we observed that the overall mean speed was lower than that from the general older population,28,29 suggesting that there might be an association between LBP and gait speed. Indeed, Leveille et al.,30 showed a negative, linear relationship between LBP intensity and gait speed in a prospective, population-based, 5-year follow-up study with 1002 American older women.
Our results suggest that these socio-demographic factors have a negative influence in overall function of older patients with LBP. There is some evidence in the LBP literature that having lower levels of education is linked to poorer prognosis for younger adults with chronic LBP.31 In general, older people with low socio economic status present worse health conditions,32 especially taking into account the influence of environmental exposure, adverse health behavior and the difficulty in accessing health care throughout life.33,34 On the other hand, there is evidence that more educated people present better health care, use more health services, and adopt more preventive measures in terms of the impact health in life.35 The present sample had predominantly lower levels of education and income status. In agreement with our findings, a survey conducted in 2003 demonstrated that 37.8% of Brazilian aged 60 years and more were illiterate, whereas 37.2% reported having 1–4 years of education.36,37 These data leads to reflection on the importance of dealing with LBP in a lifetime perspective, for it can negatively affect adults in later life in countries where many of them have unequal access to health care.
We acknowledge the study has limitations. Although we settled a formal agreement with the Primary Care Network of the city of Belo Horizonte, Brazil, it is likely we failed to consecutively include a significant proportion of participants because many patients who suffer from a new episode of pain do not have prompt access to care for this condition. Also, due to the workload of local staff, some patients might not have been referred to contact the research group. The cross sectional design of the present study prevented us from discussing causality; still, it gives us a clear scenario of older adults suffering from LBP in a country that has one of the largest older population globally. Moreover, the use of instruments of assessment that are used in the aging group gives clinicians who deal with these patients a practical framework for exploring this condition in them. Indeed, it gives researchers ground to discuss the relevance of investigating specific measurements aiming this target population. To our knowledge, this is the first study describing detailed data in LBP with older adults in Latin America.
In summary, LBP in Brazilian older people is disabling, associated with the number of comorbidities and general musculoskeletal pain, and brings significant psychological distress to those with an acute episode of pain. Within this population there are groups of people who behave worse in terms of pain, disability, physical capacity, and also psychological factors such as fear of falling and pain catastrophizing, especially considering those less educated and with lower income status. Our results highlight the need to better address both demographic and psychosocial factors in LBP in older adults, considering that the impact of pain in the older adult is context dependent. This is a starting point to pave the way for investigators and clinicians in the rehabilitation field for managing older patients with LBP especially at Primary Care level. The importance of the listed factors such as age, education and income status in the prognosis of LBP in them are the subject of further investigation by this consortium.
Conflicts of interestThe authors declare no conflicts of interest.
Authors would like to thank all researchers involved in the development of the BACE consortium, especially professors Bart W. Koes and Chris G. Maher, and those who were involved in developing the protocol, Jantine Scheele, Pim A.J. Luijsterburg, Wilco C. Peul, Maurits W. van Tulder, Arthur M. Bohnen, Marjolein Y. Berger, Sita M.A. Bierma-Zeinstra. Authors would also like to thank professors Joao Marcos Dias and Rosangela Correa Dias for their support given to the Brazilian BACE. Funding sources: The Brazil BACE cohort study was funded by Conselho Nacional de Desenvolvimento Científico e Tecnológico (CNPq). This study was also funded by two other funding agencies, Coordenação de Aperfeiçoamento de Pessoal de Nível Superior (CAPES) and Fundação de Amparo à Pesquisa do Estado de Minas Gerais (FAPEMIG), Brazil. Fabianna received a sandwich PhD scholarship from CAPES for studying at the University of Sydney. Juscelio received a PhD scholarship from CNPq.


