


Vaginal manometry is regarded as an objective method to assess pelvic floor muscles (PFM) function and can measure several variables during contraction.
ObjectiveTo determine which variables could differentiate women with/without a weak/strong PFM contraction and determine their cut-off points.
MethodsThis is a diagnostic accuracy study performed on 156 women with a mean age of 40.4 (SD, 15.9) years. The reference test was vaginal palpation and the index test was vaginal manometry (Peritron™ manometer). Variables were pressure at rest, pressure achieved with maximal voluntary contraction (MVC), MVC average, duration, gradient, and area under the curve (AUCm). The Receiver Operating Curve (AUC/ROC) and logistic regression were used to analyze the data and obtain cut-off points.
ResultsExcellent ability to discriminate women with a weak/strong PFM contraction was found for MVC average (cut-off: 28.93 cmH2O), MVC (cut-off: 38.61 cmH2O), and the AUCm (cut-off: 1011.93 cm²*s). The gradient variable had good discrimination ability (AUC/ROC=0.81; cut-off: 28.68 cmH2O/s). The MVC average assessed by manometry, menopausal status, and the presence of stress urinary incontinence (SUI) were associated with a weak/strong PFM contraction in the multivariate analysis; however, the most parsimonious model to discriminate weak/strong PFM contraction included only the MVC average (AUC/ROC = 0.95; sensitivity: 0.87; specificity: 0.91).
ConclusionThese results suggest which manometry variables are appropriate to assess and classify PFM function in females. These could be used to help physical therapists to make clinic decisions about the management of female PFM.
Inadequate pelvic floor muscles (PFM) function may be associated with the presence of urinary incontinence (UI), pelvic organ prolapse, and defecation issues.1-3 For this reason, it is essential to perform an accurate evaluation of the PFM to identify correctly the condition of the patient and prescribe a therapeutic plan.4 Although the International Continence Society recommends several methods to assess PFM function, a gold standard has not been established for this specific purpose yet. However, it is recommended to use more than one method to assess PFM contraction. Therefore, vaginal palpation and manometry are the most commonly used.5,6
To ensure a patient is able to correctly contract their PFMs, the International Continence Society recommends performing vaginal palpation prior to using other evaluation methods.7 During vaginal palpation, the examiner must simultaneously assess and grade both occlusion and cranial displacement of the muscles based on the force and elevation of the PFM around the fingers.8,9 Although it might be considered a subjective task,10 it is the only test that specifically assess the PFM contraction, because other methods may be influenced by an increased in abdominal pressure (i.e., manometry) or cross-talk (electromyography).7 Moreover, the absence of PFM contraction during vaginal palpation is a contraindication for using other methods to assess PFM function (i.e., manometry, dynamometry, and others)7 and also for interventions (i.e., pelvic floor muscles training, the first-line treatment for UI).11
Vaginal manometry provides objective measurements,12 which requires a specific device with a balloon that can measure the change of the intravaginal pressure from rest to the peak of a maximal voluntary contraction (MVC).13,14 Manometry assessment may overcome the limitations of vaginal palpation which is dependent on the experience of the evaluator to grade a weak/strong PFM contraction, because the values are generated automatically by the device.8 Also, in contrast to vaginal palpation, vaginal manometry can measure several variables during a PFM contraction, such as vaginal pressure at rest, the average variation in intravaginal pressure during a MVC, and the duration of the contraction,7 which could contribute to the patient's diagnosis and the individual physical therapeutic plan.4 However, to our knowledge, no previous study has reported the diagnostic accuracy and standard cut-off points to classify women with a weak/strong PFM contraction using the measurements obtained from a manometer.
Therefore, the aims of the present study were: 1) to determine whether the manometer is able to accurately diagnose the strength of PFM contraction (diagnostic accuracy); 2) to determine whether the manometer can discriminate between women with and without a strong PFM contraction (discriminative validity); 3) to determine which variables could better differentiate between women with a weak/strong PFM contraction and their respective cut-off scores to do so.
MethodsStudy designThis is a diagnostic accuracy study and an exploratory analysis conducted according to the Standards for Reporting Diagnostic accuracy studies (STARD) guidelines,15 approved by the Ethics and Research Committee of the Universidade Federal de São Carlos (CAAE: 51999415.9.0000.5504), Brazil in accordance with the Helsinki Declaration, conducted at the Women's Health Research Laboratory, Department of Physical Therapy, at the Universidade Federal de São Carlos.
ParticipantsWomen from São Carlos city (São Carlos, São Paulo - Brazil) were invited to participate via social media, newspaper, flyers, websites, and on radios. Women were eligible if they were more than 18 years old and were not pregnant. Women were excluded if they reported having: any neurological disease (e.g., multiple sclerosis, Parkinson's disease, and others) or physical disability; received a gynecological surgical procedure within six months of the evaluation (e.g., correction of pelvic organ prolapse, vaginal birth, surgery for hemorrhoid, and others); pelvic organ prolapse that exceeded the vaginal introit, virginity, vaginal or urinary infection, intolerance to vaginal palpation, or absence of muscle function graded by vaginal palpation (as this last one was considered an ongoing exclusion criteria). All participants provided written informed consent before the evaluation.
Procedures and examinerWomen who were interested in participating contacted the research team, and a presential meeting was scheduled. Initially, one researcher (Examiner A), who was not involved with the PFM function assessment, performed an interview. A semi-structured questionnaire was used to assess personal information which included sociodemographic, anthropometric, obstetric, and gynecologic and clinical history of the participants. Subsequently, the examiner administered the Pelvic Floor Distress Inventory-20 (PFDI-20) questionnaire through an interview to assess the presence of pelvic floor dysfunction. Although the main aim of this instrument is to assess the distress related to the presence of pelvic floor dysfunctions, we applied this self-reported questionnaire to identify the presence of urinary symptoms by the participants. This assessment was performed to characterize our sample.
Then, a physical therapist researcher, blinded to the information from the history intake, with postgraduate qualification (Examiner B, J.B.S.) and with 1-year of previous experience in PFM evaluation conducted the PFM assessment. Before the data collection, the assessor completed an 8‐h training session, conducted by one senior physical therapist, who is considered a Woman's Health specialist by the Brazilian Federal Council of Physiotherapy. Additionally, a previously reported intra-rater reliability study of bidigital vaginal palpation conducted by Examiner B, which included 120 participants, indicated substantial reliability based on Cohenʼs linear weighted kappa (κw=0.73).16,17
PFM function assessmentPFM function was assessed by vaginal palpation and vaginal manometry, by one assessor (J.B.S). The physical exam was conducted in a private room, and women were instructed to lie down in dorsal decubitus, with knees flexed 90° and hips flexed at 45° More details about the PFM assessment are provided in Supplementary Material.
Initially, women were instructed on how to perform a PFM contraction voluntarily, and the ability to perform a contraction was assessed visually. Then, they were evaluated by bidigital vaginal palpation. Three MVCs were performed with one minute rest between them and the best performance score was used for statistical analysis. Each MVC was classified according to the Modified Oxford Scale (MOS): 0=absence of muscle function; 1=flicker/pulsation under the examiner's finger; 2=weak; 3=moderate contraction, positive cranial movement, and compression of the examiner's fingers; 4= good; 5=strong.18 The same instructions used during the preliminary practice and visual inspection were used during vaginal palpation.
After five minutes rest, the same researcher performed the PFM assessment with the Peritron™ manometer (Cardio Design Pty Ltd, Oakleigh, Victoria, Australia). The balloon inserted into the vaginal canal was connected to a hand-microprocessor which recorded the peak and average pressure in centimeters of water (scale ranging from 0 to 300 cmH2O) during the PFM contraction. The other variables were registered in different units: duration (seconds), gradient (cmH2O/second), area under the curve assessed with manometry (AUCm) (cm²*s). These variables are described in the Peritron's handbook and are presented in the Supplementary Material.
During the manometry assessment, only contractions where the balloon showed a visible inward and cranial movement and where there was minimal use of accessory muscles (e.g., adductors, gluteus, and/or abdominals)19 were considered valid. The contraction of the accessory muscles was assessed by visual inspection by Examiner B.
Statistical analysisStatistical analysis was performed using STATA and SPSS software version 21 (SPSS Inc., Chicago, IL). Description of the data was performed by computing frequencies and percentages or mean and standard deviations (SD).
To perform the statistical analysis, participants were divided into two groups according to the bidigital vaginal palpation (reference test) using the MOS: women with weak PFM contraction (1 or 2 on the MOS) and strong PFM contraction (≥3 on the MOS). These values were established according to previous literature that considers a score of ≥3 on the MOS as a strong contraction,20 because the assessor can measure the cranial and ventral displacement associated with the closing of the vaginal introitus.5
Initially, we analyzed the area under the curve (AUC) using the Receiver Operating Curve (ROC) (AUC/ROC) for each of the manometry variables of interest. The largest AUC/ROC was considered to have a greater accuracy in discriminating groups. The following values were used to classify the discriminative ability of the variables/models: excellent discriminatory ability (AUC = between 0.90 and 1.0); good discrimination ability (AUC = between 0.80 and 0.89); moderate discrimination capacity (AUC = 0.70 to 0.79); poor ability to discriminate (AUC = between 0.60 and 0.69); and ability to discriminate worse than random (AUC ≤0.50).21
The cut-off points for the different variables to distinguish women with a strong from those with a weak PFM contraction were identified according to the sensitivity, specificity, percentage of correctly classified women, and likelihood ratios (LR+ and LR-). Cut-offs were selected for each variable of interest, in a way that both sensitivity and specificity could be maximized (i.e., high values). In addition, the selected cut-off value maximized the percentage of correctly classified patients. Values higher than 2 for LR+ and lower than 0.5 for LR- are recommended in the literature.15,22
To verify which combinations of variables could best discriminate between weak and strong PFM contraction, we followed previous guidance.23 We created two different models considering I) the p-value found during the univariate analysis, and II) a model that included all the variables described in the literature as possible factors of PFM weakness. First, a univariate regression was performed to analyze the association between a weak/strong PFM and each of the variables assessed by manometry plus the adjustment variables suggested by the literature (i.e., sociodemographic, anthropometric, obstetric, and gynecologic history, and clinical history variables). The significance level for the univariate analysis was set at p ≤ 0.20, and after that, variables were added to a multiple logistic regression model. The backward method was applied, and the final model included all variables that presented a p<0.05. Odd ratios (OR) were considered to describe the results, considering that OR=1 means that probability of an event is the same in both groups; OR>1, the event is more likely in the case group (strong PFM contraction); and OR<1, the event is less likely in the case group (weak PFM contraction).
Using the selected variables from the I) multiple logistic regression model considering the p-value of the variables (p ≤ 0.20) and from II) the model that included possible factors regardless the p-value, an AUC/ROC curve was analyzed to determine which model (e.g., combination of sociodemographic, anthropometric, obstetric and gynecologic history, and clinical history plus manometry variables, or manometry variables alone) could better predict between a strong/weak PFM contraction. The AUC/ROC was analyzed (according to the references values cited above) and differences between models were compared, where a p<0.05 was considered significant. If the p-value between models was not significant, we selected the most parsimonious model with the minimum number of variables.
ResultsBetween July 2018 and August 2019, 164 women were assessed, and, after the assessment, eight participants were excluded as they were not able to contract their PFM voluntarily. Our final sample was composed of 156 participants who were all included in the analysis. At vaginal palpation, 58.3 % (n = 91) of women presented a weak MVC based on the MOS, while 41.6 % (n = 65) participants showed a strong PFM contraction (MOS≥3). The STARD flowchart of the study is presented in Fig. 1.

Flowchart of the study. *The box with the “Final diagnosis” indicates the number of participants classified with a weak and strong PFM contraction according to the cut-off values of each variable from the Peritron™ manometer, established by the AUC/ROC. AUC/ROC: area under the curve; MVC: maximal voluntary contraction; PFM: pelvic floor muscles.
The average age of women with weak and strong PFM contraction was 42.8 (SD = 16.8) and 36.9 (SD= 14.2), respectively. Similar percentage of parity and a prevalence of vaginal and cesarean deliveries that range from 6.6 %−19.8 % and 3.3-%−19.8 % was observed in the group with weak contraction, while most women from the group with strong contraction was nulliparous (49.2 %) and were not climacteric women (81.5 %). The peak and MVC average of PFM contraction was 29.5 (SD = 41.9) and 20.9 (SD =11.2) cmH2O in the group with weak contraction versus 58.9 (SD= 22.1) and 40.2 (SD = 15.4) cmH2O for those with a strong contraction. All descriptive data and variables assessed by the Peritron™ manometer are presented in Table 1.
Characteristics of the sample (n = 156).
| Variables | Weak PFM contraction(n = 91) | Strong PFM contraction(n = 65) | Total sample (n = 156) |
|---|---|---|---|
| Age (years), mean (SD) | 42.8 (16.8) | 36.9 (14.2) | 40.4 (15.9) |
| Body mass index (kg/cm2), mean (SD) | 27.1 (6.4) | 24.6 (5.3) | 26.12 (6.11) |
| Number of pregnancies, n (%)012≥ 3 | 24 (26.4)24 (26.4)23 (25.3)20 (22.0) | 32 (49.2)14 (21.5)10 (15.4)9 (13.8) | 56 (35.9)38 (24.4)33 (21.2)29 (18.5) |
| Number of childbirths, n (%)012≥ 3 | 28 (30.8)26 (28.6)23 (25.3)14 (15.4) | 31 (47.7)16 (24.6)9 (13.8)8 (12.2) | 59 (37.8)42 (26.9)32 (20.5)22 (14.8) |
| Number of vaginal deliveries, n (%)012≥ 3 | 55 (60.4)18 (19.8)12 (13.2)6 (6.6) | 45 (69.2)9 (13.8)5 (7.7)6 (9.2) | 100 (64.1)27 (17.3)17 (10.9)12 (7.7) |
| Number of cesarean sections, n (%)012≥ 3 | 54 (59.3)18 (19.8)16 (17.6)3 (3.3) | 50 (76.9)10 (15.4)3 (4.6)2 (3.0) | 104 (66.7)28 (17.9)9 (12.2)5 (14.2) |
| Menopause, n (%)YesNo | 31 (34.1)60 (65.9) | 12 (18.5)53 (81.5) | 43 (27.6)113 (72.4) |
| Urinary symptoms, n (%)Urgency urinary incontinenceaStress urinary incontinencebMixed urinary incontinenceContinent | 19 (20.9)13 (14.3)23 (25.3)36 (39.5) | 6 (9.2)14 (21.5)7 (10.7)38 (58.4) | 25 (16.0)27 (17.3)30 (19.2)74 (47.4) |
| Manometry, mean (SD)Rest (cmH2O)Peak (cmH2O)Duration (seconds)MVC average (cmH2O)Gradient (cmH2O/second)Area under the curve (AUCm) (cm²*s) | 43.2 (41.9)29.5 (14.2)3.6 (1.0)20.9 (11.2)22.1 (12.5)783.0 (463.8) | 37.6 (18.9)58.9 (22.1)4.5 (2.5)40.2 (15.4)44.5 (56.1)1626.9 (700.3) | 40.9 (34.4)41.8 (23.0)3.9 (1.9)29.0 (16.2)31.4 (38.9)1134.7 (708.3) |
PFM, pelvic floor muscles; SD, standard deviation.
Table 2 presents the sensitivity, specificity, AUC/ROC analysis, and the values defined as cut-off points for each variable assessed by the manometer. The best variables to discriminate between women with a weak versus a strong PFM contraction were MVC average, followed by the peak MVC and the AUCm (excellent discriminatory ability, AUC/ROC=0.90–1.00). In addition, gradient variable had a good discriminatory ability (AUC/ROC=0.81). The remaining manometry variables had a poor or worse than random discriminatory ability (AUC/ROC<0.70).
Sensitivity, specificity, AUC/ROC, and the cut-off points for vaginal manometry assessment.
AUCm, area under the curve from the manometer; MVC, maximal voluntary contraction.
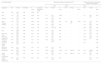
Table 3 shows the results from the univariate and multivariate models with variables that better predict a strong versus weak PFM contraction. According to the multivariable logistic regression, the best model would include the MVC average of a voluntary PFM contraction, presence of stress UI, and menopausal status (AUC/ROC=0.96). Women who had higher values on the MVC average measured by the manometer were more likely to have a strong PFM contraction (OR: 1.36, 95 %CI 1.22, 1.53). However, women with stress UI and menopause were less likely to have a strong PFM contraction (OR: 0.24, 95 %CI 0.06, 0.91; and OR: 0.19, 95 %CI 0.04, 0.81). Regarding the multivariate analysis considering possible important factors mentioned in the literature, when including all the variables measured by the manometer with a good discriminatory ability, MVC average (p = 0.004) and menopause status (p = 0.02) were the only significant variables in the model. Results did not change when we included only the MVC average from the manometer in a new model plus the important factors mentioned in the literature (MVC average (p<0.001) and menopause status (p = 0.01) were the only significant variables).
Univariate and multivariate logistic regression to predict a strong and a weak pelvic floor muscle (PFM) contraction.
| Univariate analysis | Multivariate analysis considering p<0.05 | Multivariate analysis considering all the clinical variables | ||||||||||||
|---|---|---|---|---|---|---|---|---|---|---|---|---|---|---|
| First# | Final$ | Final | ||||||||||||
| Outcomes | OR | 95 %CI | AUC/ROC | P value | Included in multivariate model | OR | 95 %CI | P value | OR | 95 %CI | p value | OR | 95 %CI | p value |
| Rest | 0.99 | 0.98, 1.02 | 0.49 | 0.836 | No | – | – | – | – | – | – | – | – | – |
| MVC | 1.16 | 1.10, 1.22 | 0.94 | 0.000 | Yes | 1.01 | 0.81, 1.26 | 0.908 | – | – | – | 1.01 | 0.80, 1.28 | 0.90 |
| Duration | 1.49 | 1.00, 2.21 | 0.59 | 0.05 | Yes | 2.83 | 0.10, 79.0 | 0.54 | – | – | – | – | – | – |
| MVC Average | 1.29 | 1.19, 1.40 | 0.95 | 0.000 | Yes | 1.76 | 0.98, 3.14 | 0.05 | 1.36 | 1.22–1.53 | 0.000 | 1.48 | 1.08, 2.02 | 0.01 |
| Gradient | 1.11 | 1.07, 1.16 | 0.81 | 0.000 | Yes | 1.12 | 0.92, 1.37 | 0.24 | – | – | – | 1.00 | 0.93, 1.08 | 0.87 |
| AUCm | 1.00 | 1.00, 1.00 | 0.92 | 0.000 | Yes | 0.99 | 0.98,1.05 | 0.25 | – | – | – | 0.99 | 0.99, 1.00 | 0.52 |
| Age | 0.97 | 0.95, 0.99 | 0.59 | 0.02 | Yes | 1.10 | 0.99, 1.23 | 0.06 | – | – | – | 1.08 | 0.97, 1.20 | 0.13 |
| Body mass index | 0.93 | 0.88, 0.99 | 0.59 | 0.03 | Yes | 0.93 | 0.80, 1.09 | 0.41 | – | – | – | 0.95 | 0.83, 1.10 | 0.54 |
| Number of pregnancies | 0.72 | 0.56, 0.93 | 0.64 | 0.01 | Yes | 0.19 | 0.01, 3.13 | 0.25 | – | – | – | 0.32 | 0.03, 2.96 | 0.31 |
| Number of childbirths | 0.73 | 0.55, 0.97 | 0.61 | 0.03 | Yes | 9.42 | 0.33, 262.6 | 0.18 | – | – | – | 210.3 | – | 0.99 |
| Number of vaginal births | 0.85 | 0.62, 1.15 | 0.55 | 0.30 | No | – | – | – | – | – | – | 0.01 | – | 0.99 |
| Number of cesareans | 0.63 | 0.41, 0.95 | 0.58 | 0.02 | Yes | 0.48 | 0.16, 1.44 | 0.19 | – | – | – | – | – | 0.99 |
| Menopause | 0.39 | 0.18, 0.84 | 0.59 | 0.01 | Yes | 0.003 | 0.00, 0.24 | 0.009 | 0.19 | 0.04,0.81 | 0.02 | 0.02 | 0.0005, 0.53 | 0.02 |
| Stress urinary incontinence | 0.51 | 0.26, 1.00 | 0.57 | 0.05 | Yes | 0.29 | 0.04, 1.79 | 0.18 | 0.24 | 0.06,0.91 | 0.37 | 0.32 | 0.07, 1.99 | 0.25 |
| Urgency urinary incontinence | 0.44 | 0.22, 0.87 | 0.59 | 0.02 | Yes | 0.35 | 0.06, 1.99 | 0.24 | – | – | – | – | 0.05, 1.52 | 0.14 |
AUCm: area under the curve from the manometer; AUC/ROC: area under the curve from the statistical analysis; MVC: maximal voluntary contraction.
Fig. 2 shows the combination between variables that best discriminated between weak and strong PFM contraction based on the logistic models run above: model 1: MVC average alone versus model 2: MVC average plus menopause and stress UI; and model 1: MVC average alone versus model 3: MVC average, peak MVC, gradient and AUCm from the manometer plus clinical characteristics. The difference between models 1 and 2 was non-significant (p = 0.10), as well as between model 1 and model 3 (p = 0.06) and then the simplest model was selected, which included only the variable MVC average as the best model.
Discussion
This study aimed to determine if specific variables assessed by manometry could discriminate between women who have or do not have a strong PFM contraction. Three variables showed excellent discriminative ability to differentiate women with weak versus strong PFM contraction (MVC average, MVC, and the AUCm). The variable gradient showed good discriminative ability. The results reported in the present study could be used as clinic guidance and could help physical therapists to make clinical decisions about the management of female PFM.
Although most of the studies that assess PFM strength by manometry reported only results for the MVC, our findings showed that other variables could be helpful to measure PFM contraction. A recent update of the terminology related to the PFM assessment published by the International Continence Society7 now include new variables that could be assessed by manometry, such as the gradient and AUCm. It was also highlighted that, with a manometer, it would be possible to assess the onset of PFM to reach the maximal pressure (e.g., gradient) or the total work performed by the muscles (e.g., AUCm) during a voluntary contraction.7 This is an advantage of manometry compared to the vaginal palpation, as this last method only assess the degree of contraction. Other variables in addition to peak MVC could improve the therapeutic program for women who want to prevent and/or treat PFM dysfunctions (e.g., UI), as it is known that in addition to strength deficits, other muscle contraction impairments, such as a delay in muscle activation, could lead to the presence of urinary symptoms.24
The results from the logistic regression highlighted that although MVC peak, MVC average, gradient, and AUCm could correctly diagnose and discriminate women with a weak versus a strong PFM contraction, the MVC average was the best variable that significantly predicted PFM contraction in the multivariable analysis, in addition to the menopausal status and the presence of stress UI. Moreover, our third model showed that the MVC average and menopause status were the best combination to discriminate PFM function, when variables considered as possible factors to PFM strength were included in the model, regardless of their p-value. However, the variable MVC average alone was chosen as the most important variable to differentiate between women with weak versus strong PFM contraction because it provided a high AUC/ROC curve, demonstrating a high level of discrimination (similar to other more complex models; p>0.05). These results are not in agreement with previous reports. Most of the studies that assessed PFM function with a manometer used the maximal peak among three MVCs or the mean of three MVCs in their statistical analysis.12,16,17,25 The finding that MVC average is the best variable to discriminate PFM contraction is novel and cannot be compared to previous studies, as no other diagnostic accuracy study using manometry are available. Future studies should be designed to analyze other psychometric properties related to MVC average.
Only menopausal status and the presence of stress UI were significantly associated with PFM contraction performance in our study. In addition, only menopause seems to be associated with PFM contraction when considering other variables in the model. One possible justification for these results is that the hormonal alterations that occur during menopause, such as estrogen deficiency,26 reduce the tension of the PFM and this relaxation27 could lead to an impairment of PFM contraction. The other factor is that stress UI is associated with urinary loss during coughing, laughing, or effort situations11 and, in those cases, urinary leakage happen because the intra-abdominal pressure is higher than the urethral pressure generated by the PFM during a contraction,28 which could indicate a weakness of the PFM.
It is important to highlight that examiners must pay attention during the evaluations conducted with a manometer.14,29 Examiners should also be careful in interpreting and comparing results with measurements performed with different devices.14 In addition, simultaneous contraction of synergist muscles should be avoided, as the increased contraction pressure seen in the manometer may be influenced by other muscle groups’ contractions, such as abdominal muscle activation.14 In the present study, women were instructed to minimize abdominal contraction, and the examiner watched for compensatory movements by visual inspection. Nonetheless, in this study, we believe that women were well instructed on how to perform a PFM contraction, as they were requested and instructed to do during visual inspection and vaginal palpation.
The strengths of the present study are related to the methodological quality. We established a protocol prior to the data collection; vaginal palpation was always performed at the beginning, and women with the absence of contraction were not included, because vaginal manometry is not a valid method to assess women who are not able to perform a voluntary PFM contraction. Moreover, our results provide evidence regarding which manometry variables are appropriate to assess and classify PFM function in women. Thus, health professionals working in this area could better understand the needs of the patient in terms of impairments at the level of the PFM and choose the best alternatives to treatment.
This study has some limitations. The same researcher who performed the manometry assessment was aware of the results obtained during vaginal palpation. However, variables obtained from the manometry were automatically generated without influence of the assessor; therefore, we believe that detection bias was minimal. The second limitation may be related to the absence of variables that could be added in the logistic regression model, such as lacerations during childbirth and/or endurance of PFM contraction. Moreover, this study was conducted according to an exploratory analysis from data that were already collected, and therefore, a sample size calculation was not performed.23 In addition, our analyses were performed without considering the presence or not of pelvic floor dysfunction (i.e., UI). It is known that the presence of pelvic floor dysfunctions may be related to PFM function,30 and results from statistical calculations stratifying the population according to the presence or absence of pelvic floor dysfunction can be informative. Therefore, recommendations for future studies include I) investigate the diagnostic accuracy of manometry stratifying by pelvic floor dysfunction, II) analyze the accuracy of the Peritron™ manometer to discriminate between weak versus strong PFM contraction in other populations, such as pregnant or postpartum women, considering different modifiable and non-modifiable variables into the logistic regression model to assess their association with PFM contraction; III) investigate the psychometric proprieties of the other variables evaluated by the Peritron™ manometer, in addition to the peak MVC.
ConclusionThe best variables from vaginal manometry to discriminate between women with weak versus strong PFM contraction are MVC average (cut-off: 28.93 cmH2O), followed by the peak of the MVC (cut-off: 38.61 cmH2O), AUCm (cut-off: 1011.93 cm²*s), and gradient (cut-off: 28.68 cmH2O/s). However, only the MVC average, menopausal status, and presence of stress UI were associated with PFM contraction in the multivariable analysis. Nonetheless, there were no significant differences when comparing the MVC average alone versus MVC average and demographic variables in the same model, and the simple model (only with MVC average) was chosen the best one to classify PFM weakness.
This study was supported in part by the Coordination for the Improvement of Higher Education Personnel (CAPES), Finance Code 001.


