


The Dysmenorrhea Symptom Interference (DSI) scale is a reliable, valid, and responsive tool to assess the interference of menstrual pain in the physical, mental, and social activities of women.
ObjectiveTo translate and cross-culturally adapt the DSI scale into Brazilian-Portuguese (DSI-BrPt) and investigate the measurement properties of this version in on- and off-menses versions.
MethodsThe original (United States) scale was translated and culturally adapted following existing guidelines. Measurement properties of the DSI-BrPt were investigated in 1387 women with dysmenorrhea. Reliability was analyzed via intraclass correlation coefficients (ICC) and test-retest reliability. Furthermore, structural validity, internal consistency (Cronbach's alpha), cross-cultural validity, construct validity (correlation with WHODAS 2.0 and SPS-6 scores questionnaires), and floor and ceiling effects were determined.
ResultsNo significant adaptations were needed during the translation process of the DSI-BrPt. The values of Cronbach's α were adequate (α ≥0.87) for the unidimensional scale. The test-retest reliability was considered adequate (ICC >0.78) and there was no systematic error for both on-menses and off-menses versions. Moreover, the DSI had a positive and strong correlation with WHODAS 2.0. There were no floor and ceiling effects neither for the total sample, nor among off-menses, or on-menses women.
ConclusionThe DSI-BrPt scale has been translated and cross-culturally adapted successfully. The DSI-BrPt scale presented adequate measurement properties. The scale is valid and reliable, and, therefore, an adequate tool for monitoring dysmenorrhea symptoms in Brazilian women during and between menses.
Dysmenorrhea is defined as colic pain in the lower abdomen, which occurs with menstruation1 and is classified as primary (menstrual pain without organic disease) or secondary (menstrual pain associated with another preexistent disease, e.g., endometriosis, adenomyosis, or uterine myoma).2 It affects around 70 % of all women during their reproductive life3; in Brazil the prevalence ranges from 54 % to 56 %.4,5 Other symptoms such as nausea, headache, diarrhea, and fatigue may be associated,2 as well as the presence of symptoms of central sensitivity6 causing a significant reduction in the quality of life of these women.7 Dysmenorrhea can be considered a public health problem,8 because it is one of the most common causes of presenteeism at school and work, as well as in social and recreational activities.9,10
There are different approaches to treat dysmenorrhea, and the main goal is to promote pain relief and increase participation. Although pharmacological interventions are the first choice for doctors and women,1 there are reports of several side effects and incomplete pain relief.11 Accordingly, physical therapy can play a key role in the rehabilitation of these women, it is non-invasive, low cost, and without side effects.12 Among the treatment approaches used are heat,13 transcutaneous electrical nerve stimulation (TENS), acupuncture, exercises, and relaxation.12
Until now, dysmenorrhea has been relatively understudied and poorly managed.14 Although there are several generic instruments to assess pain, such as the Numerical Rating Scale (NRS),15 the Visual Analog Scale, and the McGill questionnaire,16 better results are obtained when valid and specific instruments are used for targeted populations. In addition, these generic scales have a unidimensional character of pain, not accounting for the multidimensional effects involve dysmenorrhea, such as quality of life and limitations in daily activities.16
Chen et al.16 developed the Dysmenorrhea Symptom Interference (DSI) scale. This scale measures dysmenorrhea symptom interference with physical, mental, and social activities. The DSI has been validated in the United States in a large sample of women aged 14 to 42 years and has been shown to be reliable, valid, and responsive to detect menstrual pain improvement and its strong psychometric properties make it useful for both research and clinical practice.17 There is no instrument to assess the interference of dysmenorrhea symptoms in the Brazilian population, which makes it difficult to assess validly and reliably of this gynecological issue in Brazil. Thus, the aim of the present study was to translate and cross-culturally adapt the DSI to Brazilian-Portuguese (BrPt) and to assess its measurement properties in women with dysmenorrhea.
MethodsThis study followed the recommendations of the Consolidated Criteria for Reporting Qualitative Research (COREQ)18 and the COnsensus-based Standards for the selection of health Measurement INstruments (COSMIN)19 to translate and evaluate the following measurement properties of the DSI-BrPt version in women with dysmenorrhea: content validity, structural validity, measurement invariance/cross-cultural validity, hypothesis testing for construct validity, test-retest reliability, and measurement error.20 This methods for this study was approved by the Institutional Ethics Committee (CAAE 52928921.2.1001.5504, n. 5.320.757) and was conducted online from January to August 2022.
Participants were invited to participate in the study through Facebook®, Instagram®, WhatsApp, and emails from universities and schools through a Google Forms link. For the assessment of the measurement properties, Brazilian women aged 14 to 42 years, with a report of dysmenorrhea in the previous three months and able to speak, read, and write in Brazilian Portuguese were included. This age group followed the DSI development study.17 For greater sociocultural variability of the sample, we included women from different regions of Brazil (Southeast, Northeast, South, North, and Midwest), age, skin color, education, types of dysmenorrhea (primary or secondary), and periods of the menstrual cycle (on-menses and off-menses women). Pregnant women, women with up to 6 months of puerperium, and transgender were not included. Transgenders were not included because the DSI was not developed and evaluated in this population.17 There were no other exclusion criteria.
The sample size calculation followed the COSMIN recommendations21; we considered the sample variability related to the Brazilian sociodemographic census estimate for 2020 to 2021,22 with women aged 10 to 19 years and 20 to 49 years distributed, respectively, in 23 % and 77 % throughout the country. For regions, the total distribution of women is 41 % in the Southeast, 28 % in the Northeast, 14 % in the South, 9 % in the North, and 8 % in the Midwest.
For the DSI content validity, two translators and the main researcher combined the results of the translations, resulting in a synthesized version. In the back-translation, the synthesized version was back-translated into English by two other Native American professionals. The consensus of the back-translations was resolved in this sub-step by the two back-translators and the main researcher. In the next step, the content validity of the DSI was evaluated by a committee of experts with more than two years of experience in gynecology and/or women's health. After that, women with dysmenorrhea assessed the DSI content validity. In the end, all translations, back-translations and reports were sent to the DSI developer17 for approval. Thus, the DSI was culturally adapted and its content validated for Brazil, according to methods proposed by Beaton et al.23
The expert committee and the target population (women with dysmenorrhea) evaluated the content of the DSI through semi-structured interviews via telephone call. The interviews were conducted by a trained female interviewer with an interview guide containing topics on concepts and objective of the evaluation, missing concepts and suggestions for modifying the instructions to complete the questionnaire, recall period, response options, and DSI items. The interviews were recorded and literally transcribed, with content analyzed by two other researchers to organize and synthesize the suggestions for modifying the DSI. The expert committee was composed of 9 professionals who were specialists or with more than two years' experience in gynecology and/or women's health (4 female physical therapists, 3 nurses, and 2 doctors) and were asked about the relevance and understandability of the instructions to complete the questionnaire, recall period, response options and each DSI item, and the comprehensiveness of the items. Women with dysmenorrhea rated the comprehensiveness of items, relevance and understandability of the instructions, recall period, response options, and individual items. The saturation of responses was controlled using a spreadsheet after the interviews were transcribed. The content of the interview transcripts was analyzed by content analysis with selective coding and grouping of codes into thematic categories, in which the frequency of concepts and words contained in the data was noted.24
For the assessment of test-retest reliability and measurement error, we considered 24 to 48 h17 and 7 to 10 days as the time interval between test and retest, respectively, for on-menses and off-menses women in the test. To check if women were on-menses or not in the retest, they were asked to answer “yes” or “no” to the question “Are you menstruating today?”. The responses of on-menses women who answered “yes” to this question on retest were analyzed for test-retest reliability and measurement error. Off-menses women who answered “yes” to this question on retest were excluded from analyzes of test-retest reliability and measurement error.
A questionnaire about age, region of residence, skin color, education, work, study, and diagnosed gynecological disease was used to characterize the participants.
The DSI was developed in the United States and is based on a reflexive model to assess dysmenorrhea symptoms and their interference with physical, mental, and social activities in on-menses and off-menses women, following the 24-hour recall time or previous menstrual cycle, respectively. The total score of this unidimensional scale is calculated through the averages of the scores of the 9 items, with higher scores indicating greater interference of dysmenorrhea symptoms. In the development of the DSI, the internal consistency of the items was adequate (Cronbach's alpha>0.9) for on-menses and off-menses women.17
The 11-point Numerical Rating Scale (NRS) was used to assess the pain severity related to dysmenorrhea, with a response ranging from zero “no pain” to 10 “the worst imaginable pain.” The NRS assessed the mean dysmenorrhea pain on the previous menstrual cycle by the question “On average, how intense was the pain during your last menstrual cramp?”. In women with dysmenorrhea, the NRS had an adequate value for test-retest reliability (ICCagreement=0.90) and the smallest detectable change (SDC) was 2.76 points.15
The WHO Disability Assessment Schedule 2.0 (WHODAS 2.0) was used to assess the level of function in the previous 30 days in six life domains (cognition, mobility, self-care, social interaction, life activities, and participation in society). The short version of the WHODAS 2.0 contains 12 items and accounted for 81 % of the explained variance, had excellent internal consistency for all domains in women (α≥0.94), and had excellent test-retest reliability (ICC≥0.93) for the domains and total score. WHODAS 2.0 items are answered on a scale ranging from 1 (none) to 5 (extreme or can't do) points with higher scores indicating worse function.25
The Stanford Presenteeism Scale (SPS-6) assesses presenteeism related to health problems at work in the previous 30 days. This scale was translated and adapted to Brazilian Portuguese and has adequate values for test-retest reliability (ICCagreement=0.91) and internal consistency (α>0.70). SPS-6 has 6 items with 5 response options, ranging from 1 (strongly disagree) to 5 (strongly agree), in which the sum of the items generates the total score. For the sum of the answers, reversed scores must be used for items 2, 5, and 6; and the higher the score, the worse the presenteeism.26
Structural validity was analyzed by exploratory factor analysis (EFA) and confirmatory factor analysis (CFA). The Kaiser-Meyer-Olkin (KMO) test and the Bartlett sphericity test evaluated the factorability of the data, in which KMO≥0.70 and p ≤ 0.05 in the Bartlett sphericity test were considered as minimum criteria for adequacy of the data in the analysis. For the EFA, the Minimum rank and Parallel Analysis were implemented to verify the number of factors to be retained and the solution for the factors was evaluated by the quartimax rotation. If necessary, items with factor loading <0.32 were excluded.27 With the CFA, the maximum likelihood robust estimator and the Root Mean Square Error of Approximation (RMSEA), Standardized Root Mean Squared Residual (SRMR), Comparative Fit Index (CFI) and Tucker-Lewis Index (TLI) were used. RMSEA and SRMR<0.08 and CFI and TLI>0.90 were considered adequate for the tested model.28 Internal consistency was evaluated by Cronbach's Alpha, in which alpha values between 0.70–0.95 are considered good.29
For measurement invariance, we conducted multigroup CFA (MGCFA) between groups (on-menses and off-menses women) and sociodemographic region of Brazil (Southeast, North East, South, North and Midwest) in total sample at the configural, metric, and scalar levels compared consecutively in this order. The configural invariance indicates the factorial structure to be similar across groups. For the metric invariance, factor loading of configural invariance is fixed and indicates the magnitude of the factor loadings across groups. Finally, if the item loadings and intercepts are parallel across groups, the scalar invariance is evident. Values ΔCFI≤0.01 and ΔRMSEA<0.015 were considered as signs of invariance.30
Construct validity was determined using Pearson correlations between the DSI, WHODAS 2.0, and SPS-6 scores. The following Cohen31 correlation magnitudes were used: weak (0.10>r < 0.30), moderate (0.30>r < 0.50), and strong (r ≥ 0.50). The validity was determined by testing the following predefined hypotheses: positive and weak to moderate correlations between DSI and SPS-6; and positive and moderate to strong correlation between DSI and WHODAS 2.0.
For test-retest reliability, the intraclass correlation coefficient (ICC) with an interacting two-way mixed effect model was used for absolute agreement between mean measures. ICC values between 0.75 and 0.90 indicate good reliability.32 Measurement error were calculated by the Standard Error of Measurement (SEMconsistency) with the formula [differenceSD/√2], SDC at individual level with formula [SEM*1.96*√2], and the Bland and Altman plot.21 The analysis by the Bland and Altman graph involved the calculation of the Limits of Agreement (LoA) through the formula [d- ± (1,96*differenceSD)], where d- and differenceSD are, respectively, the mean and standard deviation (SD) of differences in test and retest scores.33 We also evaluated the floor and ceiling effects. Floor or ceiling effects <15 % were considered appropriate.21
To create a classification for the DSI total score, we used the partial credit model (PCM) by item response theory (IRT) due to the unidimensionality of the original scale and because the items are ordinal polytomous. Furthermore, the classical test theory (CTT) can be compared with PCM because the CTT score determine the respondent's θ level in IRT model.34 The DSI total score ranges from 1 to 5 and was associated with θ level between −4 and +4. Thus, θ=−4 is equivalent to a total score of 1 point and θ=+4 indicates a total score of 5 points on the DSI. After that, each respondent's θ was measured on the same scale and each item/response category can be positioned on the scale to obtain the probability of a respondent responding to the item's response category according to its θ≥0.50.34
Except for the Bland and Altman graphics made in SPSS 26.0 (IBM, Armonk, NY, USA), all analyses were performed in Psych, mirt, and Lavaan packages in RStudio.
ResultsThe expert committee considered the DSI to be relevant, comprehensive, and comprehensible for the assessment of dysmenorrhea interference with physical, mental, and social activities. However, some modifications were suggested for the answer options and items 2, 3, and 6. For the answer options, it was suggested that the word “very” be changed to “excessively” to better differentiate the options. For items 2 (sleep) and 3 (daily activities), it was suggested to add the words “difficulty/delay in” to item 2 and “bathing, eating, moving around, communicating, and doing housework at home, in the yard, and in the garden” to improve the description of the items. For item 6 (enjoy life), the committee suggested its exclusion due to redundancy in relation to the other items.
After acceptance by the expert committee, the content of the modified DSI was evaluated by 19 women with dysmenorrhea (mean ± age: 23.6 ± 6.7 years). Among the total sample, 9 (47.4 %) were white, 10 (52.6 %) had higher education, 5 (26.3 %) were on-menses during the evaluation, and 2 (10.5 %) had a diagnosis of secondary dysmenorrhea. For the geographic variability of the sample, 7 (36.8 %) women lived in the Southern part of Brazil, 6 (31.6 %) in the Southeast, and 2 (10.5 %) in each of the other regions. Participants considered the DSI to be relevant, comprehensive, and comprehensible for the measured construct.
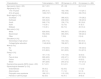
One thousand four hundred and thirteen individuals with dysmenorrhea responded to the study. Of this total, 26 (1.8 %) were excluded because they were pregnant (n = 9), transgender (n = 9), and women who had given birth or had an abortion in the previous 6 months (n = 8). Thus, for the evaluation of the DSI measurement properties, 1387 women with dysmenorrhea participated in the study – 918 (66.2 %) off-menses and 469 (33.8 %) on-menses. Table 1 shows the characteristics of the study's participants.
Demographic and clinical characteristics of the participants.
NRS, numerical rating scale; SD, standard deviation. aParticipants could select more than one category.
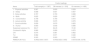
For the total sample (n = 1387), Bartlett's sphericity test (21.600; df=7; p < 0.0001) and KMO (0.892) showed that the data were factorable. Parallel analysis of EFA suggested that DSI has a single factor with explained variance of 82.47 %, 84.45 %, and 74.50 %, respectively for the total sample, off-menses, and on-menses women. In Table 2, the factor loadings (>0.50) of the DSI items, the fit indices (CFI and TLI>0.90, and RMSEA<0.06) and the internal consistency (Cronbach's Alpha≥0.87) were considered adequate for all samples.
Factor loadings of the items, Cronbach's Alpha, McDonald's Omega, and DSI adjustment indices.
CFI, Comparative Fit Index; DSI, Dysmenorrhea Symptom Interference; RMSEA, Root Mean Square Error of Approximation; SRMR, Standardized Root Mean Squared Residual; TLI, Tucker-Lewis Index..
Table 3 presents the Goodness-of-fit indexes of the MGCFA for groups (off-menses and on-menses women) and sociodemographic region of Brazil. Differences between configural and metric model, metric, and scalar model indicated the DSI is invariant across groups and sociodemographic region of Brazil (ΔCFI≤0.01 and ΔRMSEA<0.015).
Multigroup Confirmatory Factor Analysis among groups (off-menses and on-menses women) and sociodemographic region of Brazil for the DSI.
CFI, Comparative Fit Index; ΔCFI, Difference in Comparative Fit Index; DSI, Dysmenorrhea Symptom Interference; RMSEA, Root Mean Square Error of Approximation; ΔRMSEA, Difference in Root Mean Square Error of Approximation.
Correlations between DSI and SPS-6 were positive and strong for the total sample (r = 0.561; p < 0.001), off-menses (r = 0.582; p < 0.001), and on-menses (r = 0.511; p < 0.001). Correlations between DSI and WHODAS were also positive and strong for the total sample (r = 0.587; p < 0.001), off-menses (r = 0.581; p < 0.001), and on-menses (r = 0.591; p < 0.001).
Seven hundred and forty-one (53.4 %) women responded to the retest, and 502 (36.2 %) of them remained with dysmenorrhea between the test and the retest. Table 4 presents the test-retest reliability values and measurement error for the total sample and for off-menses and on-menses women. The test-retest reliability values for the total sample and for off-menses and on-menses women were considered adequate (ICC>0.7). The LoA and the Bland and Altman plots are shown in Figure 1.
Test-retest reliability and measurement errors of the DSI Scale Brazilian version.
DSI, Dysmenorrhea Symptom Interference; ICCagreement, Intraclass Correlation Coefficient; LoA, Limits of Agreement; SDC, Smallest Detectable Change; SEMconsistency, Standard Error of Measurement.
 Scale.")
There were no floor and ceiling effects in the total sample (1.4 % minimum and 1.5 % maximum score) and among off-menses (2 % minimum and 1.5 % maximum score) and on-menses women (0.4 % minimum and 1.5 % maximum score).
Thresholds and score of the DSI items are presented in Supplemental material online 1. We classify the DSI total score in “No interference” (1 point), “Mild interference” (1.01 to 2.50 points), “Moderate interference” (2.51 to 3.50 points), and “Severe interference” (3.51 to 5 points). According to this classification, 20 (1.4 %), 404 (29.1 %), 547 (39.5 %), and 416 (30 %) women were classified, respectively, with “no interference”, “mild interference”, “moderate interference”, and “severe interference.”
DiscussionThe DSI is the first scale investigating the dysmenorrhea symptoms comprehensively, not just the pain component.17 In the present study, the DSI Brazilian version showed a single factor structure and adequate measurement properties. The translation and cross-cultural adaptation to BrPt produced a version with minimal need for changes compared with the original version.17 Only item 6 was deleted due to environmental and cultural differences, as reported in the results section. It is also important that the adaptation of an instrument possesses a cultural fit, that is, its readiness to be used in different cultural contexts.23
To assess the measurement properties of the DSI, we followed the COSMIN recommendations.35 The DSI is a single factor scale, with all items assessing a single construct. Cronbach's α confirmed the adequate internal consistency of the DSI, meaning that all items are related to that single factor. The test-retest reliability and measurement error were considered good for both on-menses and off-menses versions. Comparing both versions, the on-menses version is less subject to recall bias due to the shorter period.17 The dysmenorrhea pain tends to decrease over time of menstruation days, which can generate a bias when the woman completes the retest after the end of the symptoms.17 In the original version, the reliability was acceptable.17
The analysis of the construct validity of the DSI presented positive and strong correlations with SPS-6 and with WHODAS. Our initial hypothesis was to find a positive and weak to moderate correlation between DSI and SPS-6 and a positive and moderate to strong correlation between DSI and WHODAS. The high correlation found may demonstrate that all scales are related to health status. Further, these results can demonstrate that functionality and presenteeism were strongly correlated with dysmenorrhea. Studies show that dysmenorrhea can be as intense and disabling as renal colic,36 that 1 in 5 women are absent from school because of dysmenorrhea. About 37 % of women suffer impacts in social and sports activities,3 in addition to decreased sleep quality, worsening mood, increased comorbidities such as chronic pelvic pain, fibromyalgia, anxiety, and depression.37
The percentage of participants with maximum and minimum score indicated no ceiling and floor effects. This means that the scale is sensitive to detect significant changes over time. From a clinical point of view, results stratified into cutoff points help in the classification of risk groups, which is important to facilitate decision-making. Based on our results, cut-off points were established for the DSI scale, total score can be interpreted as “No interference”, “Mild interference”, “Moderate interference”, and “Severe interference”. This statistical approach helps clinicians to identify changes that are not merely a normal variation of the tool but instead changes in the clinical condition of the patient.
There are different approaches to the treatment of dysmenorrhea. Until now, drug approach, through prostaglandins inhibitors, are the most common initial therapy for dysmenorrhea.38 There is a need for emphasis on alternative methods of conservative treatment, so as to reduce the dependence on drugs for alleviating the symptoms. Therefore, physical therapy stands out with its variety of non-pharmacological resources for pain relief, such as the use of TENS, manual therapies, heat therapies, kinesiotherapy, and acupuncture.12 With a questionnaire, it is possible to convert subjective information into objective and measurable data. The differential diagnosis of dysmenorrhea may allow health professionals to establish a therapeutic objective and to choose the appropriate treatment for the patient's complaint.
This study has many strengths. First, it is the first translated and validated scale that assesses the interference of dysmenorrhea in the Brazilian population during and outside the menstrual period. Second, the sample size calculation followed the COSMIN recommendations. A limitation of the study was the sampling bias due to the online format, which resulted in low representation by women with a lower-level education. According to the IBGE, around 15 % of the Brazilian population does not have access to the internet.22 We suggest that for future studies, another recruitment method should be adopted to reach this population.
ConclusionThe DSI-BrPt version seems to have good measurement properties for identifying dysmenorrhea symptoms in Brazilian women. Furthermore, this instrument can be used by professionals in clinical settings and for scientific research.
The study was partially supported by Coordination of Improvement of Higher Education Personnel - Brazil (CAPES) – Finance Code 001, and the São Paulo Research Foundation (FAPESP), grant number 2021/11871-9 (GTA). Role of funding sources: The funders had no role in study design, data collection, and analysis, decision to publish, or preparation of the manuscript.


