
Functional capacity assessment is important in patients with chronic obstructive pulmonary disease (COPD). It can be performed by the six-minute walk test (6MWT) on a 30-meter track. However, such space is not always available in clinical settings.
ObjectivesTo compare the performance between the 6MWT on a 30- (6MWT30) and 20-meter (6MWT20) track; to evaluate the validity and reliability of the 6MWT30 and the 6MWT20; and to determine for which patients track length has the greatest impact on performance.
MethodsPatients with COPD randomly performed two 6MWT30 and two 6MWT20 on two different days and were also assessed using the COPD Assessment Test (CAT) and modified Medical Research Council (mMRC) scale.
ResultsThirty patients (23 men; mean ± standard deviation FEV1%pred: 45.6 ± 12.1) participated in the study. They walked a greater distance on the 6MWT30 than on the 6MWT20 [mean difference: 22.1 m (95% CI: 12, 32 m)]. The longer the 6MWT30 distance, the greater the difference between the 2 tests (r = 0.51; p = 0.004). The 6MWT20 showed high reliability [ICC: 0.96 (95% CI: 0.77, 0.99)] and the results were associated with the distance walked on the 6MWT30 (r = 0.86), CAT (r = −0.53), and mMRC (r = −0.62). Patients who walked ≥430 m in the 6MWT30 presented a difference between the tests greater than those who walked <430 m (34.5 ± 23.3 m vs. 12.6 ± 24.1 m; respectively; p = 0.01).
ConclusionsPerformance was higher on the 6MWT30, with the difference increasing as performance improved. Therefore, the 6MWT20 is valid and reliable to evaluate functional capacity but should not be considered interchangeable with the 6MWT30, especially for the less disabled patients with COPD.
Patients with chronic obstructive pulmonary disease (COPD) often show impaired ability to perform activities of daily living (ADL),1 which results in, exacerbations, hospitalizations, and potentially death.2 Therefore, functional evaluation is essential in routine clinical practice,3 especially in pulmonary rehabilitation (PR).4 The six-minute walk test (6MWT)2 is widely used to measure functional capacity, as it is a simple and inexpensive tool and objectively reflects ADL of individuals with COPD.2 The American Thoracic Society and the European Respiratory Society (ATS/ERS)2 provide standardized guidelines for the performance of the 6MWT on a 30-m track (6MWT30). However, a 30-meter track is not always available in clinical settings, with often used shorter tracks requiring a greater number of deceleration/acceleration phases when changing direction, potentially affecting performance.5
Conducting the 6MWT on a 10-meter track, showed high test-retest reliability (ICC = 0.98) and performance was strongly correlated with those on the 6MWT30 (r = 0.96; p < 0.01).5 However, the use of the shorter track caused a clinically relevant reduction in 6MWT performance. In children,6 healthy older adults,7 and individuals with hepatic cirrhosis8 and stroke,9 the performance on the 6MWT conducted on a 20-meter track (6MWT20) resulted in a difference of less than 10%. Therefore, the 6MWT20 may be an alternative, easier to conduct clinically, for patients with COPD. Because performance on the 6MWT30 is related to several important outcomes, such as hospitalizations and mortality, and is a component of the BODE index,10 which reflects the COPD prognosis, alternative convenient testing distances are important to determine. However, the impact of performing the 6MWT on a 20 versus a 30 m track, in individuals with COPD of various severity and disability level, is unknown.
The objectives of this study, conducted on individuals with COPD, were: 1) to compare performance between the 6MWT30 and the 6MWT20; 2) to determine validity and reliability of the 6MWT30 and the 6MWT20; and 3) to determine if the impact of a shorter track is consistent across all levels of performance on the 6MWT30.
MethodsPatients referred to the Nucleus for Assistance, Education and Research on Pulmonary Rehabilitation (NuReab) of Universidade de Santa Catarina (UDESC) participated in this study. The inclusion criteria were: diagnosis of COPD (GOLD 2–4)11; clinically stable status over the previous four weeks; age between 40 and 80 years; and optimized disease-targeted medical therapy (the use of medication prescribed by the pulmonologist for at least one month). The exclusion criteria were: other respiratory diseases or disabling health conditions; use of home oxygen therapy; hospitalization in the previous 12 weeks; participation in PR in the previous six months; inability to perform any of the study evaluations; grade III obesity,12 smoking cessation in the previous six months; and suspicion of COPD exacerbation during the protocol. The study protocol was approved by the Human Research Ethics Committee of the Universidade do Estado de Santa Catarina UDESC, Florianópolis, Santa Catarina, Brazil CAAE: 62638716.0.0000.0118. All participants signed an Informed Consent Document.
ProceduresData were collected from August 2016 to March 2018. The protocol consisted of three testing sessions performed on separate days with a maximum interval of seven days between the first and last evaluation. On the first day, whole-body plethysmography was performed and the COPD Assessment Test (CAT) questionnaire and the modified Medical Research Council (mMRC) and the London Chest Activity of Daily Living (LCADL) scales were also administered to investigate convergent validity of the 6MWT20. On the second day, based on randomization (Microsoft Excel®), two 6MWT30 or 6MWT20 trials were performed to establish test-retest reliability. On the third day, the same procedure was followed, but using the other track distance to perform the 6MWT.
The MasterScreen Body plethysmograph (Erich Jaeger®, Friedberg, Germany) was used to assess pulmonary function according to the ATS/ERS criteria.13,14 The predicted values for the Brazilian population were used.15
The CAT total score was used to assess the impact of COPD on the patients’ health.16 The patients’ scores on the mMRC17 scale were used to measure dyspnea. Dyspnea-related limitation on ADL was based on the percentage score on the LCADL (LCADL%total).18,19
The six-minute walk test (6MWT)The 6MWT was performed according to the ATS/ERS,2 and always conducted by the same two raters not blinded to the 6MWT version. One rater provided instructions and the other monitored heart rate (HR), pulse oxygen saturation (SpO2), and dyspnea. Two tests were performed on the same day and a minimum interval of 30 min was allowed between them or until the physiological and symptoms variables returned to baseline levels.2 The predicted values for the Brazilian population were calculated.20 The data are presented as follows: first test (test), second test (retest), and “best test” which was the best of the two trials. The data for both tests were used to establish test-retest reliability and the “best test” was used for all other data analyses. Based on the previously established minimal important difference (MID) of 30 meters for the 6MWT3021 patients were classified into two groups (difference <30 meters and ≥30 meters) based on the difference between “best test” performance for the 6MWT30 and 6MWT20.
During the 6MWT, the patients wore a triaxial accelerometer (Dynaport Move Monitor - McRoberts BV®, The Netherlands) positioned at waist height and aligned with the spine. The accelerometer and the band to secure it in place (total weight of 375 g) was used to assess intensity of movement (IM), number of steps, and energy expenditure (EE).
Data analysisThe data were analyzed using the IBM Statistical Package for Social Sciences version 20.0 (IBM®, Armonk, United States of America). The distribution of data was assessed using the Shapiro-Wilk test. The significance level was set at 5%.
Comparison of performance in 6MWT30 and 6MWT20Paired Student's t-tests or Wilcoxon tests were used to compare the results for each variable between the 6MWT30 and 6MWT20 and also the 2 trials for each track. The Pearson or Spearman coefficients were used to determine the level of association between the difference in distance walked between tracks (6MWT30–6MWT20) and the best distance walked for the 6MWT30. The strength of the correlations was classified as: weak (r ≥ 0.3 to 0.49), moderate (r ≥ 0.50 to 0.69), strong (r ≥ 0.70 to 0.99), and perfect (r = 1).22 The independent Student's t-test or Mann-Whitney U test was used to compare outcomes between those with <30meters and those with ≥30meters difference between performance on the 6MWT30 and 6MWT20.
Discriminating patients with clinical impact on performanceA receiver operating characteristic (ROC) curve was used to identify a cutoff point for the 6MWT30 to discriminate patients whose difference of the distance walked between the 6MWT30 and the 6MWT20 was above the MID.2
Validity and reliability of 6MWT30 and 6MWT20The Pearson or Spearman coefficients were used to test: concurrent validity (with the 6MWT30) and convergent validity of the 6MWT20 (with the results on the CAT, LCADL, mMRC, and pulmonary function); and correlation between variables of the 6MWT30 and 6MWT20. The reproducibility of performance in the 6MWT30 and the 6MWT20 was assessed using intraclass correlation coefficients (ICC) and was classified as: low (ICC < 0.40), moderate (ICC ≥ 0.40 to 0.75), and high (ICC > 0.75).22 Bland-Altman plots were used to verify agreement of performance between the 6MWT30 and the 6MWT20, as well as between test-retest for each track length. The standard error of measurement [SEM = SDx√(1-ICC)], where SD is the standard deviation of the first test, and the minimum detectable change (MDC = 1.96x√2.SEM)23 were calculated.
Sample sizeThe sample size was calculated with GPower software version 3.1, using Student's t-tests with a power of 80%, a bidirectional α of 0.05, and the mean difference and standard deviation of the distance walked between the 6MWT30 and the 6MWT20 found in the pilot study prior to this study with seven patients (9 ± 17.7 m). Using this information, 30 patients were estimated to be required for the study.
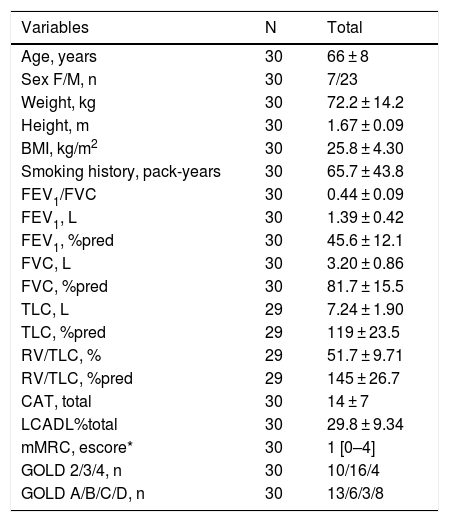
ResultsOf 33 potentially eligible patients, 30 completed the protocol (Table 1). One patient was excluded due to grade III obesity,12 one patient due to smoking during the protocol; and one patient dropped out. Data related to IM, number of steps, and EE during the 6MWT were not obtained for four patients.
Descriptive data for the patient in the study.
| Variables | N | Total |
|---|---|---|
| Age, years | 30 | 66 ± 8 |
| Sex F/M, n | 30 | 7/23 |
| Weight, kg | 30 | 72.2 ± 14.2 |
| Height, m | 30 | 1.67 ± 0.09 |
| BMI, kg/m2 | 30 | 25.8 ± 4.30 |
| Smoking history, pack-years | 30 | 65.7 ± 43.8 |
| FEV1/FVC | 30 | 0.44 ± 0.09 |
| FEV1, L | 30 | 1.39 ± 0.42 |
| FEV1, %pred | 30 | 45.6 ± 12.1 |
| FVC, L | 30 | 3.20 ± 0.86 |
| FVC, %pred | 30 | 81.7 ± 15.5 |
| TLC, L | 29 | 7.24 ± 1.90 |
| TLC, %pred | 29 | 119 ± 23.5 |
| RV/TLC, % | 29 | 51.7 ± 9.71 |
| RV/TLC, %pred | 29 | 145 ± 26.7 |
| CAT, total | 30 | 14 ± 7 |
| LCADL%total | 30 | 29.8 ± 9.34 |
| mMRC, escore* | 30 | 1 [0–4] |
| GOLD 2/3/4, n | 30 | 10/16/4 |
| GOLD A/B/C/D, n | 30 | 13/6/3/8 |
Data presented as mean ± standard deviation; BMI: Body Mass Index; FEV1: forced expiratory volume in first second; FVC: forced vital capacity; TLC: total lung capacity; RV: residual volume; CAT: COPD Assessment Test; mMRC: modified Medical Research Council; LCADL: London Chest Activity of Daily Living; *data presented as median[minimum – maximum]; GOLD: global initiative for chronic obstructive lung disease.
The distance walked, IM, number of steps, and EE showed strong correlation between the best 6MWT30 and 6MWT20 (r = 0.86, p < 0.001; r = 0.92, p < 0.001; r = 0.92, p < 0.001; r = 0.94, p < 0.001, respectively). The distances walked in the 6MWT30 and the 6MWT20 negatively correlated with CAT (r = −0.48, p = 0.01; r = −0.53, p = 0.003; respectively) and with mMRC (r = −0.53, p = 0.002; r = −0.62; p < 0.001; respectively) results. The LCADL%total showed a tendency to correlate with the performance on the 6MWT20 (r = −0.33; p = 0.07) and did not show any correlations with the 6MWT30 (p = 0.29). The distances walked in the 6MWT30 and 6MWT20 did not correlate with the pulmonary function variables (p > 0.05).
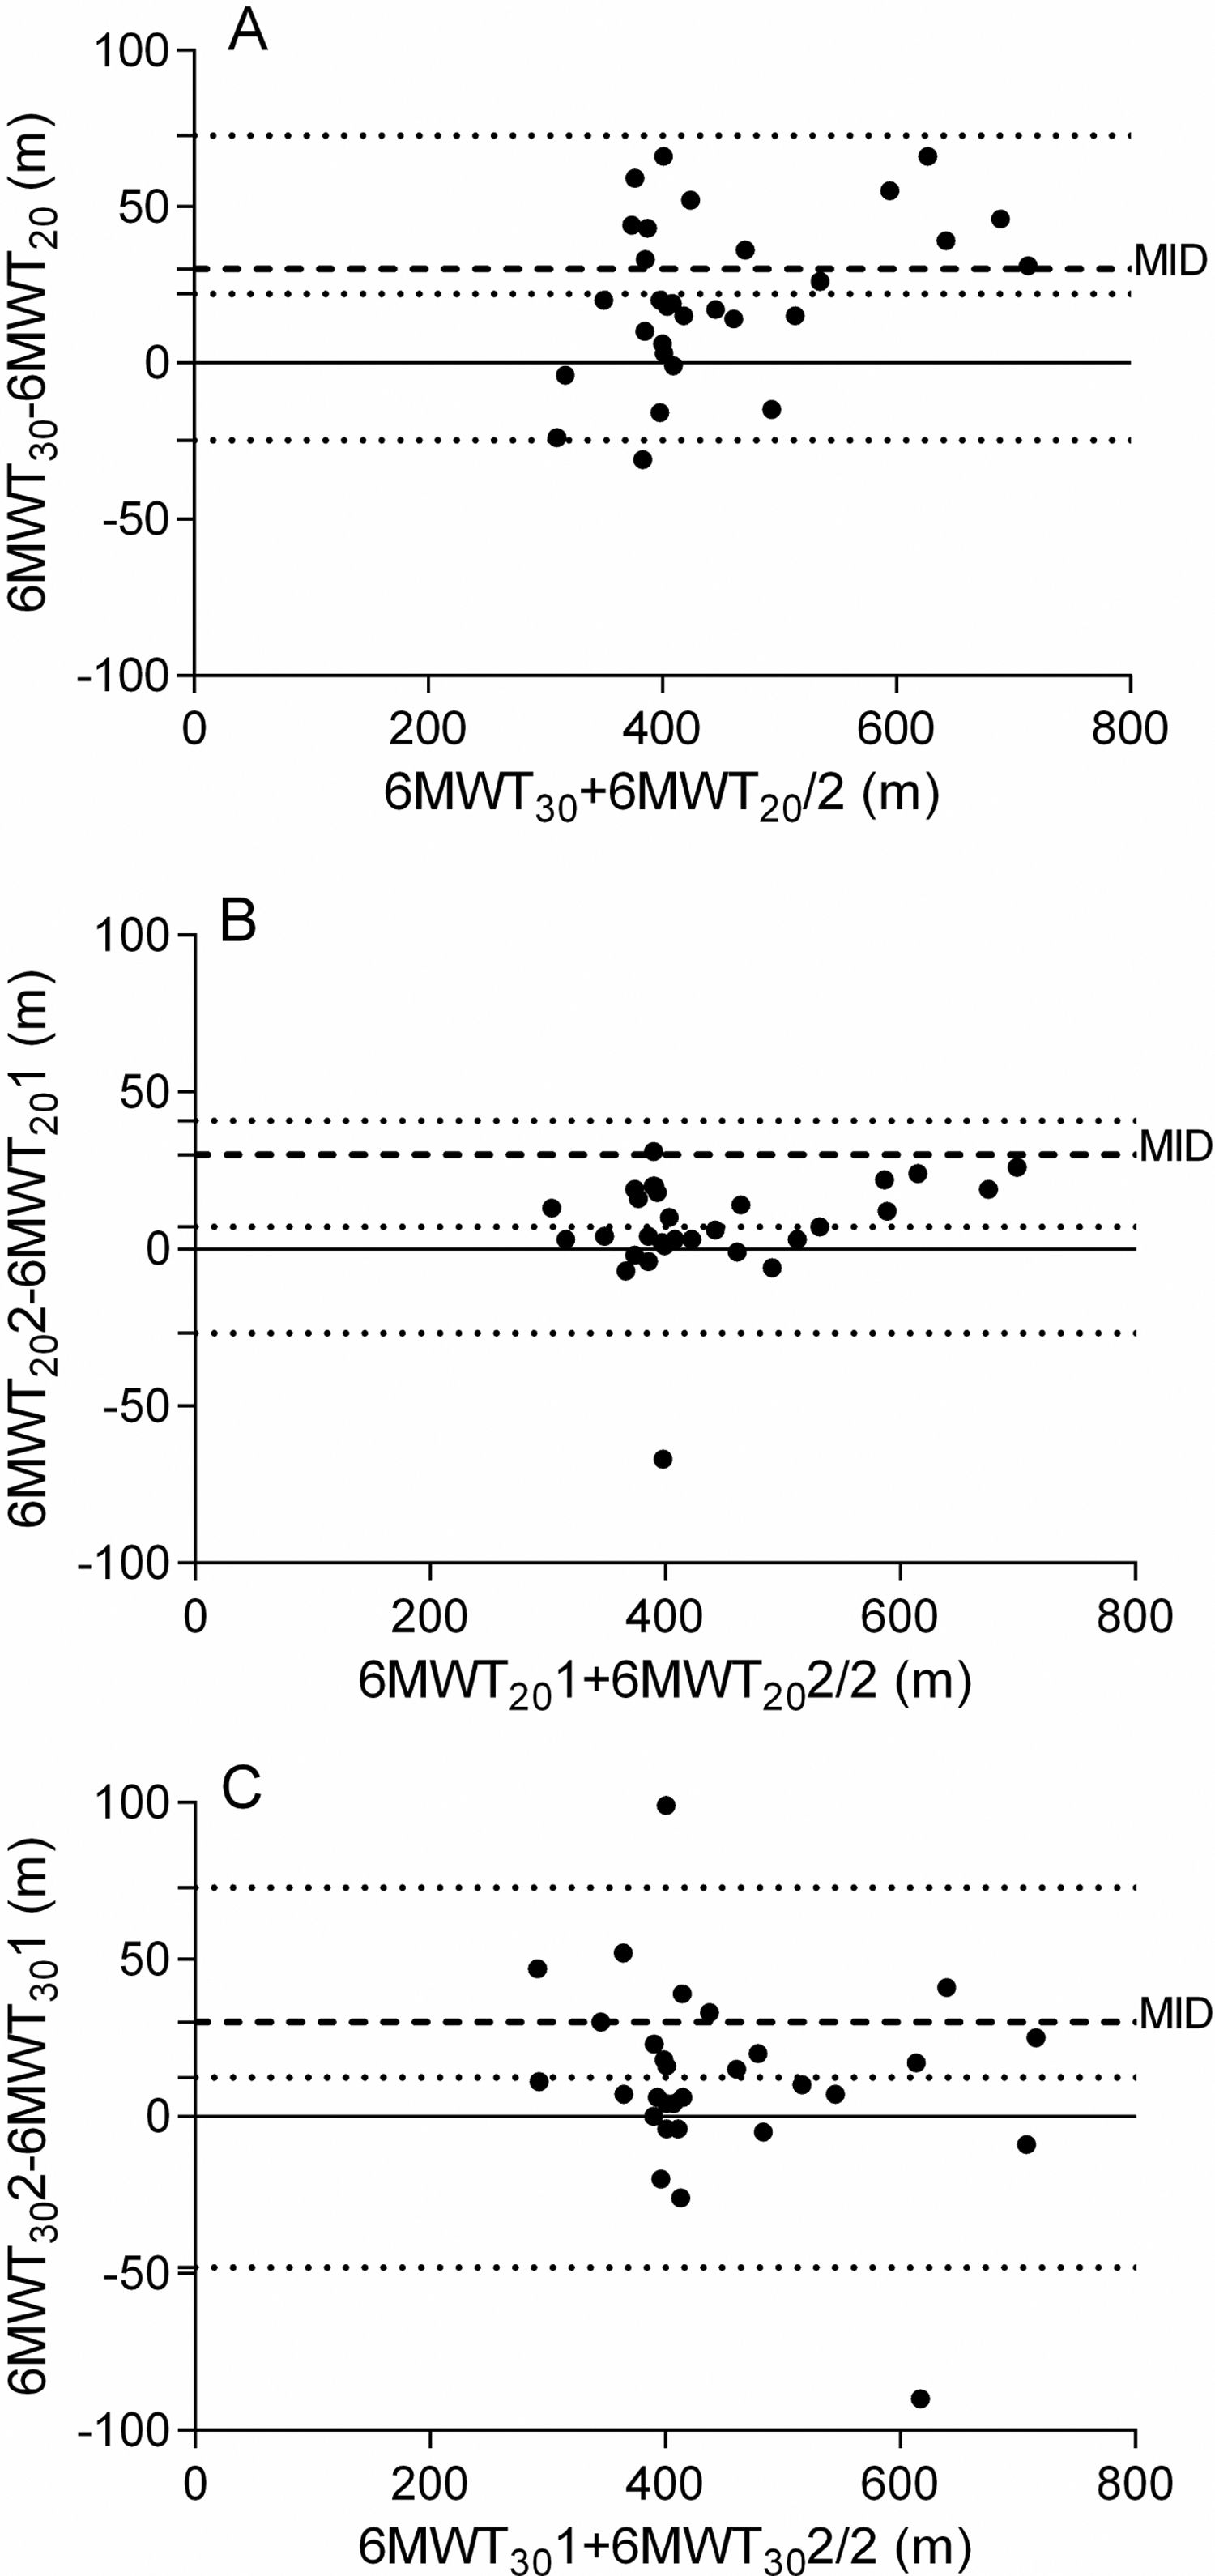
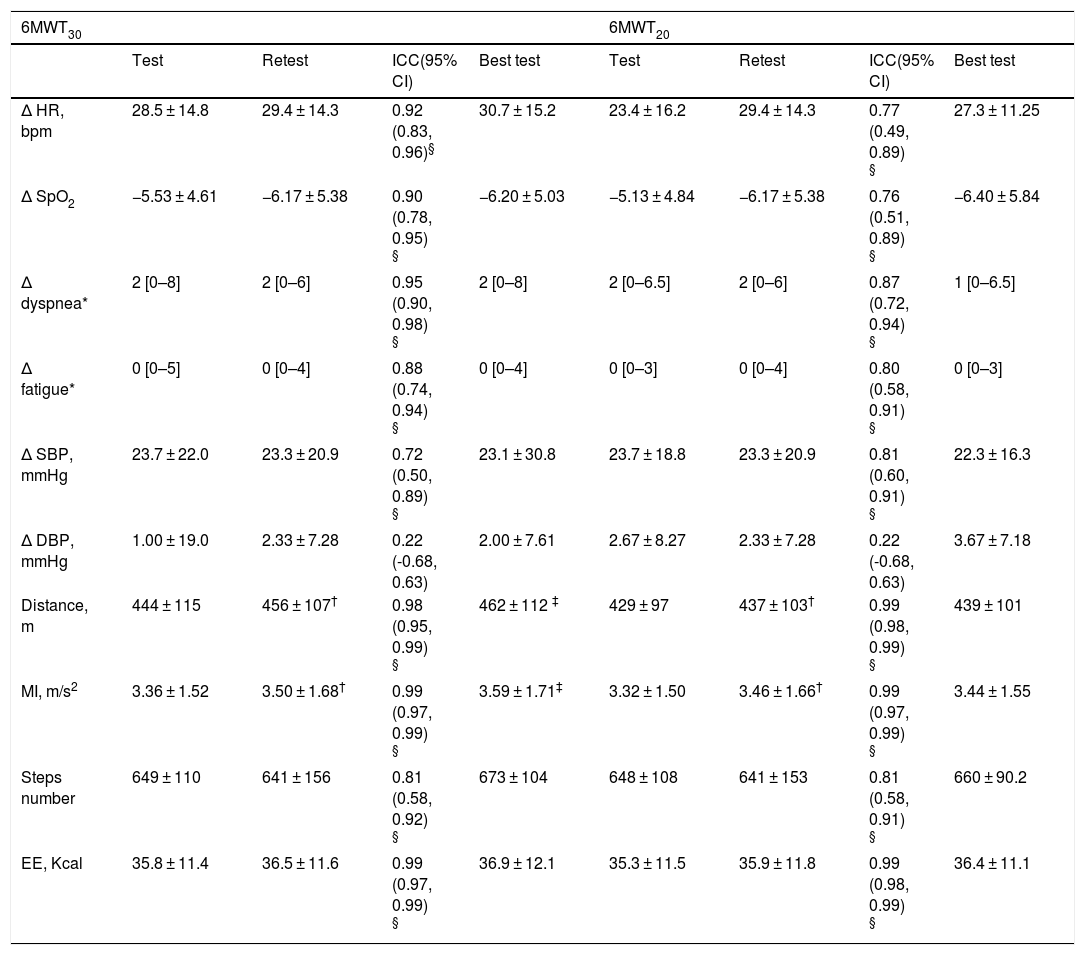
There was high reproducibility of the distance covered between test-retest for the 6MWT20 (ICC = 0.99; 95% CI 0.98, 0.99) and 6MWT30 (ICC = 0.98; 95% CI 0.95, 0.99). There was high reproducibility of the results on the heart rate between test-retest for the 6MWT20 ICC of 0.77 (95% CI 0.49, 0.89; p < 0.05) and 6MWT30 ICC of 0.92 (95% CI 0.83, 0.96; p < 0.05). There was no difference between the test-retest (6MWT30 and 6MWT20) for any of the cardiovascular variables (p > 0.05) (Table 2). The SEM of 6MWT30 and 6MWT20 were 16.3 vs. 19.4 m and the MDC was 45.2 vs. 53.8 m, respectively. In both 6MWT20 and 6MWT30, the patients increased performance in the retest (Table 2). The learning effect in the 6MWT20 and 6MWT30 did not differ (1.63% vs. 2.70%, respectively; p = 0.29). Bland-Altman plots confirmed that most patients showed better performance in the retest in both 6MWT (Fig. 1). It could be observed that patients with better mean distance walked in the 6MWT30 and 6MWT20 also presented greater difference between both tests (Fig. 1A).
Physiological and performance variables for the six minute walk test.
| 6MWT30 | 6MWT20 | |||||||
|---|---|---|---|---|---|---|---|---|
| Test | Retest | ICC(95% CI) | Best test | Test | Retest | ICC(95% CI) | Best test | |
| Δ HR, bpm | 28.5 ± 14.8 | 29.4 ± 14.3 | 0.92 (0.83, 0.96)§ | 30.7 ± 15.2 | 23.4 ± 16.2 | 29.4 ± 14.3 | 0.77 (0.49, 0.89) § | 27.3 ± 11.25 |
| Δ SpO2 | −5.53 ± 4.61 | −6.17 ± 5.38 | 0.90 (0.78, 0.95) § | −6.20 ± 5.03 | −5.13 ± 4.84 | −6.17 ± 5.38 | 0.76 (0.51, 0.89) § | −6.40 ± 5.84 |
| Δ dyspnea* | 2 [0–8] | 2 [0–6] | 0.95 (0.90, 0.98) § | 2 [0–8] | 2 [0–6.5] | 2 [0–6] | 0.87 (0.72, 0.94) § | 1 [0–6.5] |
| Δ fatigue* | 0 [0–5] | 0 [0–4] | 0.88 (0.74, 0.94) § | 0 [0–4] | 0 [0–3] | 0 [0–4] | 0.80 (0.58, 0.91) § | 0 [0–3] |
| Δ SBP, mmHg | 23.7 ± 22.0 | 23.3 ± 20.9 | 0.72 (0.50, 0.89) § | 23.1 ± 30.8 | 23.7 ± 18.8 | 23.3 ± 20.9 | 0.81 (0.60, 0.91) § | 22.3 ± 16.3 |
| Δ DBP, mmHg | 1.00 ± 19.0 | 2.33 ± 7.28 | 0.22 (-0.68, 0.63) | 2.00 ± 7.61 | 2.67 ± 8.27 | 2.33 ± 7.28 | 0.22 (-0.68, 0.63) | 3.67 ± 7.18 |
| Distance, m | 444 ± 115 | 456 ± 107† | 0.98 (0.95, 0.99) § | 462 ± 112 ‡ | 429 ± 97 | 437 ± 103† | 0.99 (0.98, 0.99) § | 439 ± 101 |
| MI, m/s2 | 3.36 ± 1.52 | 3.50 ± 1.68† | 0.99 (0.97, 0.99) § | 3.59 ± 1.71‡ | 3.32 ± 1.50 | 3.46 ± 1.66† | 0.99 (0.97, 0.99) § | 3.44 ± 1.55 |
| Steps number | 649 ± 110 | 641 ± 156 | 0.81 (0.58, 0.92) § | 673 ± 104 | 648 ± 108 | 641 ± 153 | 0.81 (0.58, 0.91) § | 660 ± 90.2 |
| EE, Kcal | 35.8 ± 11.4 | 36.5 ± 11.6 | 0.99 (0.97, 0.99) § | 36.9 ± 12.1 | 35.3 ± 11.5 | 35.9 ± 11.8 | 0.99 (0.98, 0.99) § | 36.4 ± 11.1 |
Data presented as mean ± standard deviation; 6MWT30: six minute walk test in track of 30 m; 6MWT20: six minute walk test in track of 20 m; ICC: intraclass correlation coefficient; 95% CI: 95% confidence interval; Δ: difference; HR: heart rate; SpO2: pulse oxygen saturation; SBP: systolic blood pressure; DBP: diastolic blood pressure; MI: movement intensity; EE: energy expenditure.*Data presented as median [minimum – maximum]; †p < 0.05 to test vs. retest; ‡p < 0.05 to best 6MWT30 vs. best 6MWT20; §p < 0.05 to ICC.
: (A) of the best 6MWT on tracks of 30 m (6MWT30) and of 20 m (6MWT20); (B) test-retest of 6MWT20; (C) test-retest of 6MWT30. The central continuous line represents the mean difference between two 6MWT, and the upper and lower dotted lines represent the upper limits (UL) and lower limits (LL) of agreement. The dashed lines represent the minimum important difference (MID) of 30 m for the 6MWT. (A) LL: -24.8; UL: 72.7; mean: 22.1; (B) LL: −26.7; UL: 40.9; mean: 7.10; (C) LL: −48.1; UL: 72.9; mean: 12.4.")
Bland-Altman plot of walking distances in meters (m): (A) of the best 6MWT on tracks of 30 m (6MWT30) and of 20 m (6MWT20); (B) test-retest of 6MWT20; (C) test-retest of 6MWT30. The central continuous line represents the mean difference between two 6MWT, and the upper and lower dotted lines represent the upper limits (UL) and lower limits (LL) of agreement. The dashed lines represent the minimum important difference (MID) of 30 m for the 6MWT. (A) LL: -24.8; UL: 72.7; mean: 22.1; (B) LL: −26.7; UL: 40.9; mean: 7.10; (C) LL: −48.1; UL: 72.9; mean: 12.4.
The patients presented difference between test-retest only for the first day of testing, regardless of the randomization. When the 6MWT30 was tested first, the mean difference was 20 m (95% CI 8.69, 31.3; p = 0.004) for the 6MWT30 and −0.08 m (95% CI −14.5, 14.4; p = 0.16) for the 6MWT20. When the 6MWT20 was tested first, the mean differences were 7.33 m (95% CI −11.0, 25.6; p = 0.18) for the 6MWT30 and 11.9 m (95% CI 6.61, 17.2; p = 0.001) for the 6MWT20.
Comparison of performance in 6MWT30 and 6MWT20Eighteen patients (60%) performed the 6MWT20 first. All patients showed the same baseline values prior to the 6MWT30 and the 6MWT20 (p > 0.05). The distance walked and IM were, on average, 22.1 m (95% CI: 12, 32 m) and 0.15 m/s2 (95% CI: −0.007, 0.31 m/s²) higher for the 6MWT30 than the 6MWT20, respectively (p < 0.05). The number of steps tended to be, on average, 13.6 (95% CI: −0.70, 27.9) higher in the 6MWT30 when compared to the 6MWT20 (p = 0.06). There was no difference between the 2 tests for any of the cardiovascular variables (p > 0.05) (Table 2).
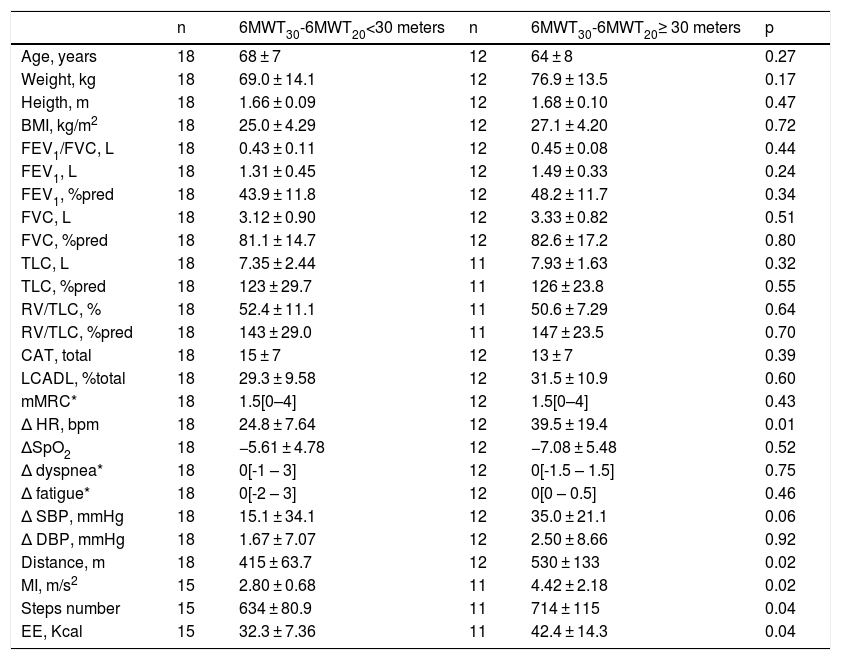
The distance walked in the best 6MWT30 showed moderate correlation with the difference of the distance walked between the tests (6MWT30–6MWT20) (r = 0.51; p = 0.004). Most patients (60%) had a difference of < 30 m between the 6MWT30 and the 6MWT20. The distance walked, IM, number of steps, EE, and the difference (posttest–pretest) in heart rate (HR) in the 6MWT were higher in the patients who walked a distance ≥30 ms in the 6MWT30 compared to the 6MWT20 (Table 3).
Comparison between characterization data based on difference of 30 ms or more on the 6MWT30.
| n | 6MWT30-6MWT20<30 meters | n | 6MWT30-6MWT20≥ 30 meters | p | |
|---|---|---|---|---|---|
| Age, years | 18 | 68 ± 7 | 12 | 64 ± 8 | 0.27 |
| Weight, kg | 18 | 69.0 ± 14.1 | 12 | 76.9 ± 13.5 | 0.17 |
| Heigth, m | 18 | 1.66 ± 0.09 | 12 | 1.68 ± 0.10 | 0.47 |
| BMI, kg/m2 | 18 | 25.0 ± 4.29 | 12 | 27.1 ± 4.20 | 0.72 |
| FEV1/FVC, L | 18 | 0.43 ± 0.11 | 12 | 0.45 ± 0.08 | 0.44 |
| FEV1, L | 18 | 1.31 ± 0.45 | 12 | 1.49 ± 0.33 | 0.24 |
| FEV1, %pred | 18 | 43.9 ± 11.8 | 12 | 48.2 ± 11.7 | 0.34 |
| FVC, L | 18 | 3.12 ± 0.90 | 12 | 3.33 ± 0.82 | 0.51 |
| FVC, %pred | 18 | 81.1 ± 14.7 | 12 | 82.6 ± 17.2 | 0.80 |
| TLC, L | 18 | 7.35 ± 2.44 | 11 | 7.93 ± 1.63 | 0.32 |
| TLC, %pred | 18 | 123 ± 29.7 | 11 | 126 ± 23.8 | 0.55 |
| RV/TLC, % | 18 | 52.4 ± 11.1 | 11 | 50.6 ± 7.29 | 0.64 |
| RV/TLC, %pred | 18 | 143 ± 29.0 | 11 | 147 ± 23.5 | 0.70 |
| CAT, total | 18 | 15 ± 7 | 12 | 13 ± 7 | 0.39 |
| LCADL, %total | 18 | 29.3 ± 9.58 | 12 | 31.5 ± 10.9 | 0.60 |
| mMRC* | 18 | 1.5[0–4] | 12 | 1.5[0–4] | 0.43 |
| Δ HR, bpm | 18 | 24.8 ± 7.64 | 12 | 39.5 ± 19.4 | 0.01 |
| ΔSpO2 | 18 | −5.61 ± 4.78 | 12 | −7.08 ± 5.48 | 0.52 |
| Δ dyspnea* | 18 | 0[-1 – 3] | 12 | 0[-1.5 – 1.5] | 0.75 |
| Δ fatigue* | 18 | 0[-2 – 3] | 12 | 0[0 – 0.5] | 0.46 |
| Δ SBP, mmHg | 18 | 15.1 ± 34.1 | 12 | 35.0 ± 21.1 | 0.06 |
| Δ DBP, mmHg | 18 | 1.67 ± 7.07 | 12 | 2.50 ± 8.66 | 0.92 |
| Distance, m | 18 | 415 ± 63.7 | 12 | 530 ± 133 | 0.02 |
| MI, m/s2 | 15 | 2.80 ± 0.68 | 11 | 4.42 ± 2.18 | 0.02 |
| Steps number | 15 | 634 ± 80.9 | 11 | 714 ± 115 | 0.04 |
| EE, Kcal | 15 | 32.3 ± 7.36 | 11 | 42.4 ± 14.3 | 0.04 |
Data presented as mean ± standard deviation; 6MWT30: six minute walk test in track of 30 m; 6MWT20: six minute walk test in track of 20 m; FEV1: forced expiratory volume in the first second; FVC: forced vital capacity; RV: residual volume; TLC: total lung capacity; CAT: COPD Assessment Test; LCADL: London Chest Activity of Daily Living; mMRCm: modified Medical Research Council; Δ: delta; HR: heart rate; SpO2: pulse oxygen saturation; SBP: systolic blood pressure; DBP: diastolic blood pressure; MI: movement intensity; EE: energy expenditure; *data presented as median[minimum – maximum].
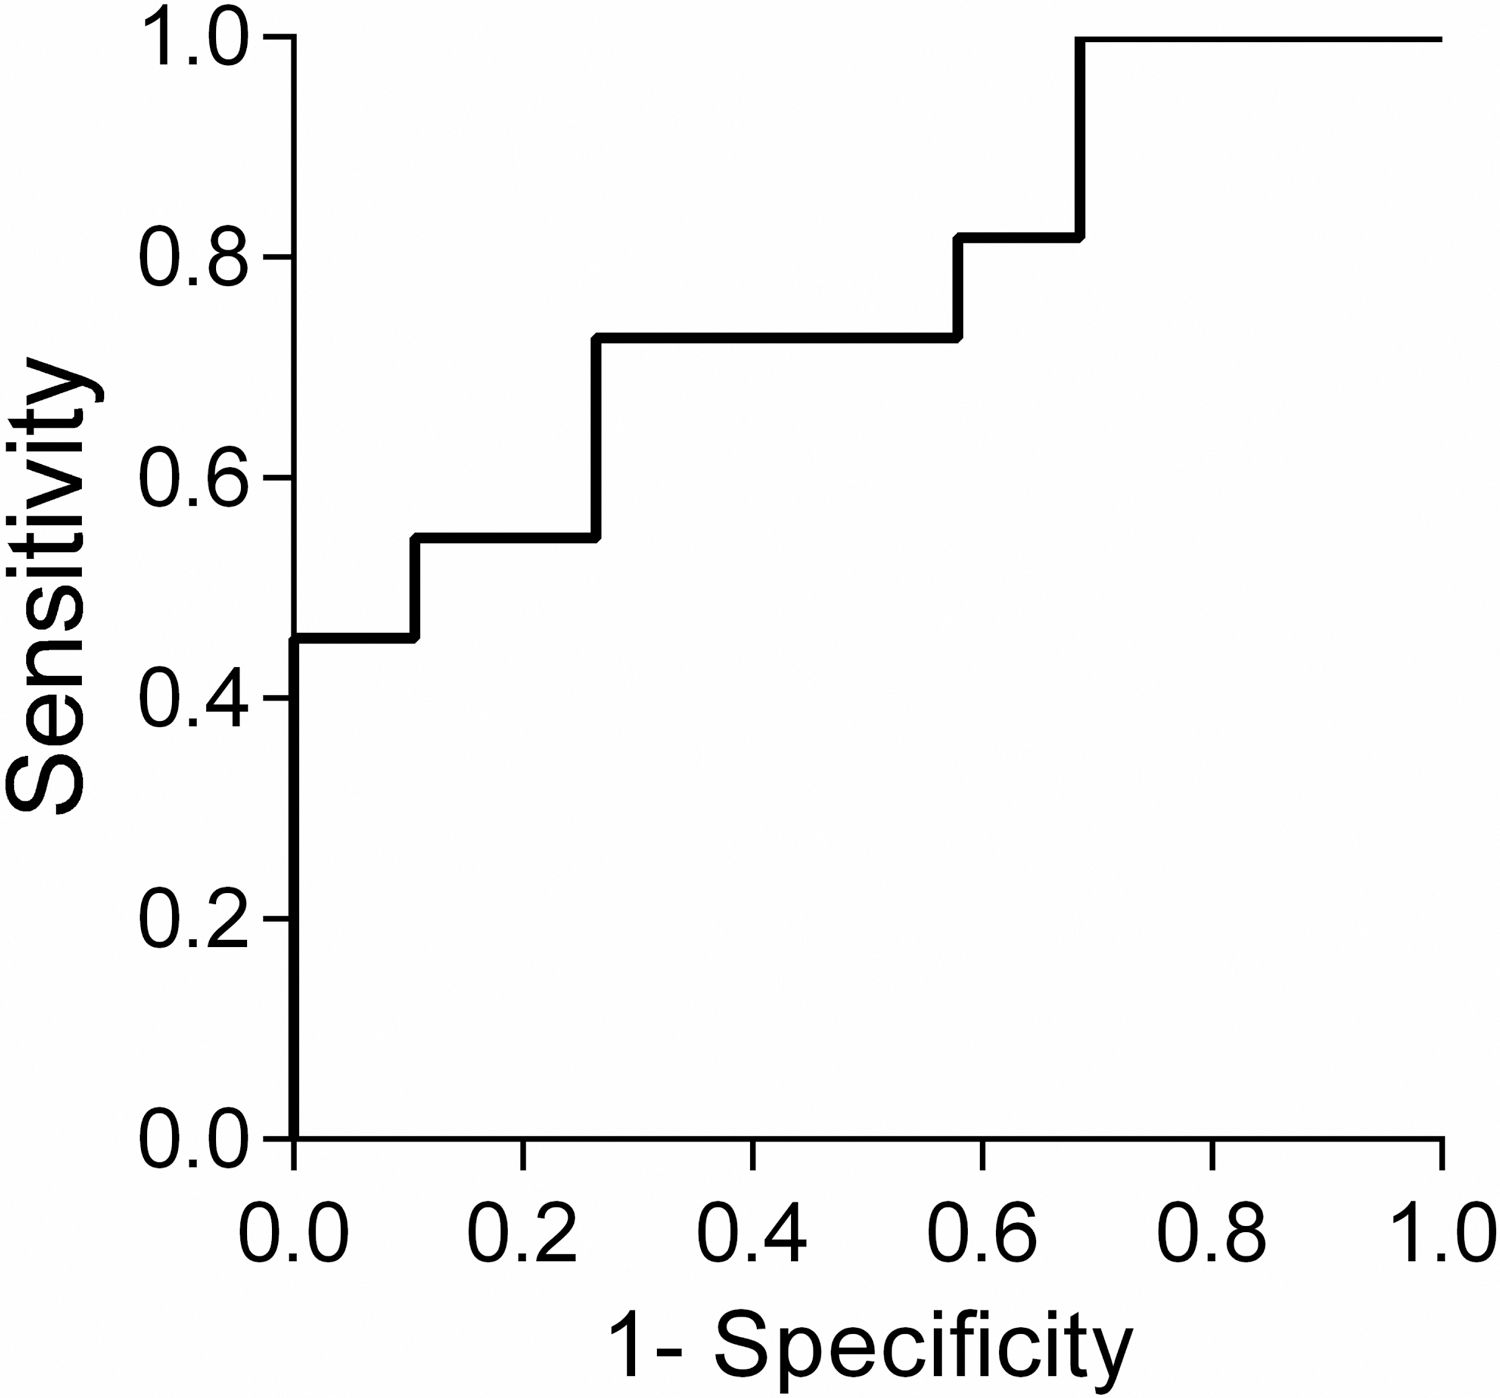
A ROC curve (Fig. 2) indicated a cutoff point of 430 m to discriminate patients who showed a difference of 30 m or greater in the distance walked in the 6MWT30 compared to the 6MWT20. The mean difference between the distance walked in the 6MWT30 and 6MWT20 was greater in patients who walked ≥430 m than in patients who walked <430 m (34.5 ± 23.3 m vs. 12.6 ± 24.1 m; respectively; mean difference = 22 m; 95% CI: 3.93, 39.8; p = 0.01).
![Receiver operating characteristic (ROC) curve for the 6MWT on tracks of 30 m cut-off point to discriminate the patients where the difference in walking distance between the tracks of 30 m and 20 m was clinically relevant, considering the minimum important difference of 30 m for the 6MWT. Cut-off = 430 m; area under the ROC curve (AUC) = 0.75 [95% CI: 0.57, 0.93]; p = 0.02; Sensitivity = 67% and Specificity = 72%.](https://static.elsevier.es/multimedia/14133555/0000002500000001/v1_202101200718/S1413355519302205/v1_202101200718/en/main.assets/gr2.jpeg?xkr=ue/ImdikoIMrsJoerZ+w929KGak/HkDVotJdTxfGQIzRP8bGX3WOiYpLrst8D4xL6rUqTNQdaOqCvwJFaxHZ4/xvGJ+5rDr04Fb6rQnPHPhO+oGNg4w0DitvFibppICbwhWr+1beodPVUJLT37wZ0jJCSLm3IMi6o9YhooIUaE/ulng+j90IL2DHH5APQpjcbrRKRVWQ02nktU9LDf0dNjiIP/53XniOGx1e4ptMBHuBkxJ1GCcjk3HjZUjwLyp3K1CXAJ9bTYYOVmIrj1E2aGuMEOFf4h2tQU0l4eNqJDo= "Receiver operating characteristic (ROC) curve for the 6MWT on tracks of 30 m cut-off point to discriminate the patients where the difference in walking distance between the tracks of 30 m and 20 m was clinically relevant, considering the minimum important difference of 30 m for the 6MWT. Cut-off = 430 m; area under the ROC curve (AUC) = 0.75 [95% CI: 0.57, 0.93]; p = 0.02; Sensitivity = 67% and Specificity = 72%.")
Receiver operating characteristic (ROC) curve for the 6MWT on tracks of 30 m cut-off point to discriminate the patients where the difference in walking distance between the tracks of 30 m and 20 m was clinically relevant, considering the minimum important difference of 30 m for the 6MWT. Cut-off = 430 m; area under the ROC curve (AUC) = 0.75 [95% CI: 0.57, 0.93]; p = 0.02; Sensitivity = 67% and Specificity = 72%.
The main results of this study were that the 6MWT30 performance was better than the 6MWT20 performance, with the difference increasing as performance improved. Additionally, it was observed that for patients with walking distance less than 430 m on the 6MWT30, using the 20-meter track, may not lead to a clinically important impact on the results.
Although the 6MWT30 is widely used and has well-established criteria, its clinical applicability is limited to settings that are able to guarantee the measurement properties of the test, as recommended by the ATS/ERS.5,6,21,24 As expected, the 6MWT20 performance was lower when compared to the 6MWT30 in the present study. In healthy older adults, the minimum track length required for acceleration varies from 2.17 to 3.23 m, and 1.80–1.85 m25 for deceleration. Therefore, about 20% of a 20-meter track is used for acceleration and deceleration, while only 13% in a 30-meter track. This may explain the difference found in performance between the 6MWT30 and the 6MWT20.
Another point to be highlighted is that the cardiovascular overload was similar between the tests. This may have occurred as the 6MWT usually has a submaximal character, with stable oxygen uptake beyond the third minute.26 Therefore, the difference between the tests may not have been sufficient to cause a greater cardiovascular overload in the 6MWT.
Although the mean difference between the 6MWT30 and the 6MWT20 in the total sample was below MID, this difference was clinically relevant in 40% of the patients. The comparison of patients with more and less difference than the MID between the 6MWT30 and the 6MWT20 showed that these patients did not differ in relation to pulmonary function, dyspnea, health status, and perception of functional limitations. However, patients with 6MWT30–6MWT20 ≥MID achieved higher scores for distance, number of steps, IM, EE, and cardiovascular overload in the 6MWT30. A correlation also showed that the greater the difference in the distance walked between the 6MWT30 and the 6MWT20, the longer was the distance walked on the 6MWT30. In addition, in the present study, a ROC curve analysis identified that, in patients who walked more than 430 m, the shorter length track caused a clinically relevant impact on performance. Therefore, it is important to highlight that, especially in patients with better functional capacity, results from the 30-meter and 20-meter tracks may not be interchangeable. Moreover, it is not possible to interpret the performance on the 6MWT20 based on the cut-off points or reference values established for the 6MWT30.
There is a large body of evidence demonstrating validity and reliability of the 6MWT conducted on the 30-meter track in patients with COPD. In the current study, the 6MWT20 was also valid to assess functional capacity of patients with COPD, showing strong correlations with performance in the 6MWT30 (r = 0.86; p < 0.001). Furthermore, the 6MWT20 proved to be reliable and, similar to the 6MWT30, demonstrated weak and moderate correlation with CAT and mMRC, reflecting health status and dyspnea, which are important outcomes of the disease. This demonstrates that in case of limited physical spaces for the patients with greater functional impairment, the 6MWT20 could be a valid and reliable option. Most patients increased the distance covered in the retest, possibly due to the learning effect already demonstrated in several studies.21,27 Bland-Altman plots confirmed the best retest performance of both 6MWT and evidenced that most patients showed variation within the limits of agreement, reinforcing the reliability of the tests. In the current study, the results of the learning effect of the 6MWT30 differed from those reported in the literature: Troosters et al.28 showed a learning effect of 2.6%, while Spencer et al.29 and Hernandes et al.27 reported a 7% increase in distance in the retest. Interestingly, the present study demonstrated similar learning effect in the 6MWT20 and 6MWT30. The small learning effect found in the 6MWT30 and 6MWT20 may have occurred because the protocol design in which the patients performed four 6MWT. Besides, there was statistically difference between test-retest only on the first day. Since “the effect of learning” is likely to occur due to improved motor coordination, stride length adaptation, decreased anxiety, and recognition of the limits of the test,9 this fact may allow the adoption of strategies to turn at the end of each track more efficiently in the retest and this may have occurred in both tests independently of track length.
This study may present some limitations. Patients with use of long-term oxygen were excluded, and thus the results cannot be extrapolated to this population. The small sample size may have compromised the statistical power to run the ROC curve analysis. However, we found an area under the ROC curve of 0.75 (95% CI: 0.57, 0.93), which is considered acceptable.30 Another factor to be considered was the failure to blind the major outcome assessor. Nevertheless, special care was taken to maintain the same assessor responsible for the verbal encouragement and instructions to avoid different intonations.
Notably, to our knowledge, this was the first study to compare the 20-meter track with the track recommended by the ATS/ERS, as well as to demonstrate validity and reliability of the 6MWT20 for assessing functional capacity of patients with COPD. The results have demonstrated that, despite the lower performance when compared to the 30-m track, the 6MWT20 does not underestimate functional capacity of patients who walk shorter distances. Therefore, the 6MWT20 could be an option to those patients in settings in which the performance of the 6MWT30 is not feasible.
ConclusionsPerformance was higher on the 6MWT30, with the difference between tracks increasing as performance improved. The 20-meter track replacing 30-meter track may not cause a clinically important impact on the walking distance of patients with lower performance, but it may cause that impact on those with better performance. Therefore, the 6MWT20 is valid and reliable to evaluate functional capacity but should not be considered interchangeable with the 6MWT30, especially for the less disabled patients with COPD.
AcknowledgementsThis study was financed in part by Coordenação de Aperfeiçoamento de Pessoal de Nível Superior – Brasil (CAPES) – Finance Code 001 and supported by the Fundação de Amparo à Pesquisa e Inovação do Estado de Santa Catarina – FAPESC – Brazil (PAP UDESC) (Chamada Pública N° 01/2016). The funding sources had no involvement in the study design; in the collection, analysis, and interpretation of data; in the writing of the report; and in the decision to submit the article for publication.
Conflicts of interestThe authors declare no conflicts of interest.


