It is not known which laboratory indices of muscle mass, strength or quality can distinguish functional performance in healthy middle aged women. The aim of this study was to (a) examine the association between upper leg lean tissue mass, knee extensor strength, muscle quality (strength per unit lean tissue mass) and functional performance and (b) to determine the utility of tertiles of muscle strength and muscle quality to distinguish gradations of functional capacity in healthy 50–70y women.
MethodsUsing a cross-sectional study design, one hundred and twenty-eight healthy 50–70y women (mean age: 60.4, SD=5.1y) underwent body composition assessment (dual X-ray absorptiometry) and performed maximal voluntary isometric contractions of the knee extensors (Con-Trex Dynamometer). Functional performance was assessed using a 5 repetition and 30s chair rise test and 900m gait speed test.
ResultsOrdered by muscle strength or muscle quality, those in the highest tertile (T1) demonstrated greater functional performance than those in lowest tertile (T3). There was no association between upper leg lean tissue mass and functional performance (r=≤0.06). Muscle strength explained a greater proportion of the variance in all functional performance measures relative to muscle quality (R2=0.13–0.36 vs. R2=0.11–0.16).
ConclusionUpper leg lean tissue mass is not associated with physical performance in healthy 50–70y women. These results suggest strength relative to the body mass being accelerated distinguishes gradations in functional performance better than muscle quality healthy 50–70y women.
Expert working groups1,2 have recommended older adult muscle health is evaluated in terms of mass, strength and functional performance. Laboratory measures of muscle mass, strength and quality which are considered to be below ‘normal’ are associated with functional impairment in the elderly.3–5 Low relative muscle mass, knee extensor strength and muscle quality (strength per unit tissue) have been associated with self-reported and objectively measured functional limitation in older adults.3–7 These associations have been studied extensively in older adults >65y6,8–10 and as a result tend to use simple tasks related to activities of daily living (ADL) such as gait speed tests <6m.11–15
However, it is well documented that age-related change in muscle characteristics which precede functional limitation become noticeably different from a young adult aged ∼50y.16,17 In contrast to age groups >65y, comparatively little is known about the time course and transition to functional limitation after the age of ∼50y. We previously reported age-related difference in lean tissue mass (LTM), muscle strength and quality in healthy older women.18 Furthermore, our research group19 and others20 identified short gait speed tests (<10m) as unsuitable measures of functional performance for use in healthy older adults. This is primarily due to short performance tests inability to detect age-related difference where expected in healthy adults. Instead, we proposed that extended gait speed and chair rise tests are used due to their greater construct validity in detecting age-related difference and greater association with maximal voluntary knee extensor strength.19
Ideally, laboratory measures of muscle mass, strength and quality which can distinguish gradations of capacity with aging would also reflect functional performance. Lower body strength is thought to undergo a preferential age-related decline relative to the upper body. Specifically, quadriceps strength declines at a greater rate than grip strength in healthy volunteers.21 This preferential decline is thought to be due to a change in activity patterns22,23 and is greatest in women.24 Hicks et al.,11 have suggested that establishing cut points from strength at one time point is predictive of future mobility decline in a population based sample of older (∼73y) men and women. Researchers have recently12,25 classified healthy older (65–84y) adults into tertiles based on body composition, muscle function and functional performance. This approach may be more appropriate for attempting to distinguish gradations of capacity in healthy adults whereby cut-points below ‘normal’ in muscle health may not be able to identify individuals of lower physical capability.24
At present, there are two indices of lower extremity muscle function most commonly reported in the literature. The first is knee extensor strength which is normally assessed by a commercially available dynamometer and the second is muscle quality normally expressed as knee extensor strength per unit muscle or LTM mass. Both indices have been associated with functional performance in older (>65y) adults. Hairi et al.5 reported that muscle quality had a stronger association than muscle mass with both self-reported and objectively measured physical disability in community dwelling older (≥70y) men (n=1612). However, the authors also identified muscle strength (grip and quadriceps strength) as having stronger associations with all outcome measures than either muscle mass or muscle quality. Similarly, Visser et al.26 reported lower muscle strength and greater fatty infiltration as stronger predictors of self-reported mobility limitation than muscle mass in well-functioning older (70–79y) adults (n=2631). More recently, Hayashida et al.27 reported knee extension strength but not appendicular LTM to be associated with maximal gait speed (11m) in 318 community dwelling Japanese men and women (≥65y).
Whilst muscle strength can be determined using a variety of cost effective techniques which are often portable, muscle quality requires imaging technology, often at significant time, financial and training cost. The association between both indices and functional performance has received considerably less attention in adults <70y of age. Furthermore, it is not yet known whether one index is superior to the other in distinguishing gradations of capacity in healthy middle aged adults.
The aim of this study was to examine the association between upper leg LTM, knee extensor strength, muscle quality and functional performance in healthy 50–70y women. A secondary aim of this investigation was to determine the utility of tertiles of muscle strength and muscle quality to distinguish gradations of functional capacity in healthy 50–70y women.
MethodsParticipantsA convenience sample (n=204) of healthy older (50–70y) adults were recruited via email and word of mouth from the University of Limerick campus community and surrounding area to take part in the University of Limerick Aging Study.18,19,28,29 For the present investigation, one hundred and twenty-eight women participated in a cross-sectional study design. Participants received a full medical screening and physical examination prior to the assessment of body composition, maximal voluntary knee extensor strength and functional performance. Those defined as healthy, i.e. disease free based on Greig et al.30 and independent living were invited to participate. Disease free included the absence of clinical, cardiovascular or musculoskeletal abnormality as determined by a medical doctor. Participants were required to be healthy but not masters athletes as defined by Drey et al.31 After receiving a complete explanation of the procedures, benefits and risks of the study, all participants gave their written informed consent. This study was approved by the Research Ethics Committee of the University of Limerick (EHSREC 10/45).
MeasuresWhole body and regional body composition analysis was conducted using dual X-ray absorptiometry (iDXATM; GE Healthcare, Chalfont St Giles, Buckinghamshire, UK), in accordance with procedures used in the University of Limerick Body Composition Study.28,32 To standardise test conditions and tissue hydration, participants were instructed to refrain from strenuous exercise in the 12-h period before testing and to attend after an overnight fast. Participants consumed 500mL of water 1h prior to the scan and were instructed to void and defecate, if required, immediately prior to measurement. Height was measured to the nearest 0.1cm (SECA stadiometer) and body mass to the nearest 0.1kg (Tanita MC-180MA Body Composition Analyzer, Tanita UK Ltd.). Daily calibration of the scanner employed a phantom spine containing composites of bone, fat and LTM. Participants wore light clothing and removed all metal objects such as belts and jewellery. The thigh, representing upper leg LTM was measured from the inferior side of the lesser trochanter until the tibio-femoral joint.
Reliability of estimate was calculated using a convenience sub-sample of participants who were asked to take part in the reliability study when attending a 6-month or 1y follow up as part of the healthy aging study. Reliability of estimate was calculated in accordance with recommendations from the International Society of Clinical Densitometry. Repeat scans on a sub-sample of 87 participants between 18 and 70y (mean age: 35.0, SD=17.0y) was used to assess reliability of whole body LTM and total leg LTM. The root mean square coefficient of variance (RMSCV) was found to be 0.6% and 1.4% respectively. Of the 87 participants 22 were between the ages of 50–70y. The older adult scans (n=22) were further segmented to provide the additional measurement of upper leg LTM. The RMSCV was found to be 0.7%, 1.4% and 2.3% respectively for whole body, total and upper leg LTM respectively.
Maximal voluntary isometric contractions of the knee extensors of the dominant limb were measured using a Con-Trex MJ Dynamometer (Con-Trex MJ; CMV AG, Dubendorf, Switzerland) in accordance with procedures used by Francis et al.18 The participants were tested during two sessions held 7 days apart. Warm up consisted of 5min on a bicycle ergometer (Monark Ergomedic; 828E), at a workload of 40W in accordance with the methodology of Lynch et al.17 The knee extensors and flexors of the dominant limb (the limb used to kick a ball) were tested. Participants were seated with a hip flexion angle of 110°. The back of the knee joint was on the edge of the seat with a knee angle of −60° from anatomical zero (180°), which has been demonstrated to be the angle of maximal isometric force generation.33 The distal shin pad of the dynamometer was attached 4–5cm proximal to the medial malleolus using a velcro strap. Lever length (mean length: 22.7, SD=2.3cm) was recorded as in Lynch et al.17 Two seatbelts were applied across the chest and pelvis whilst velcro straps were applied to the mid-thigh to reduce extraneous movement during contractions. The dynamometer rotational axis was aligned with the lateral femoral condyle (knee joint axis of rotation). The absolute zero (point at which gravity is acting vertically) was recorded prior to each trial. Participants were instructed to perform 2 submaximal voluntary isometric contractions (50 and 75% of perceived maximum) prior to each test series as in Maffiuletti et al.,34 with a 1min rest period in between. The participant then performed 3 MVC's of the knee extensors separated by 2min of stationary rest. The participant was instructed to consistently produce their maximal force rapidly (as hard and as fast as possible in the sagittal plane) and to maintain that force for 3–4s. Participants received a 5s count down with a distinct emphasis on “Go”. No overt verbal encouragement was provided due to the difficulty in standardising it for all participants.35 Visual feedback of the instantaneous dynamometer torque was provided to the participants on a computer screen. This was used to show the participant the type of contraction required and also to provide encouragement to reach their maximum as in Bazzucchi et al.36 The participant then received 2–3min of stationary rest to allow set up of the protocol to measure MVC of the knee flexors. To assess the knee flexors, the distal shin pad was removed and replaced along the posterior portion of the triceps surae; 4–5cm above the medial malleolus. The participant was then instructed to repeat the procedure used for extension above whilst kicking back (flexion) in the sagittal plane.
The coefficient of variance (CV) for the knee extensors and flexors was 3% in both cases with a range of 0–9%. There was an increase in the number of participants with repeated measures which satisfied the criteria for a MVC (knee extensors (n=9) and flexors (n=7)) on day 2 (CV 3%; range 0–6%). A 2-way mixed model intra class correlation coefficient (ICC) was used to assess absolute agreement. The ICC on day 1 and day 2 for the knee extensors (0.99 (95% CI 0.99–1.00) and 1.00 (95% CI 1.00–1.00) respectively) and flexors (0.99 (95% CI 0.99–1.00) and 0.99 (95% CI 0.99–1.00) respectively) demonstrate excellent within day reliability. The intra-class correlations between testing sessions for knee extensors and flexors were 0.85 (95% CI 0.79–0.90) and 0.89 (95% CI 0.83–0.92) respectively. The highest value for both days was used for analysis in this study. Muscle quality was expressed as knee extensor torque per kilogram upper leg LTM as this has been reported as the most appropriate index of muscle quality when using DXA and isokinetic dynamometry as the measurement tools.18
The ability to rise from a chair was assessed using a timed 5 repetition chair rise test37 and by counting the number of chair rises completed in 30s.38 Maximal extended gait speed, using a one or a combination of walking, jogging or running, was assessed by the time taken to complete 900m (4 laps of a 225m indoor track).19,29 All measures were repeated separated by 7 days in order to reduce the potential for a learning effect. The highest measures from both days are used to report tertiles of functional performance and to examine associations with LTM, muscle strength and muscle quality. All measurements were carried out by the same exercise scientist to exclude issues with inter-tester reliability.
AnalysisPhysical characteristics, body-composition, muscle strength and functional performance data were checked for normality of distribution by using a Kolmogorov–Smirnov test or Shapiro–Wilk test and expressed as means and SDs for normally distributed variables and medians (IQRs) for asymmetric distributed variables. Functional performance was classified per tertile of muscle strength and muscle quality. A one-way ANOVA or Kruskall Wallis test was used to determine if differences existed between tertiles. Pairwise comparison resulting from a Bonferroni post hoc test were used to determine differences between tertiles. The association between the predictor variables (upper leg LTM, muscle strength and muscle quality) and the criterion variables (functional performance) were assessed using a Pearson's or Spearman's correlation for normal and non-normal data respectively. Correlations were classified based on British Medical Journal recommendations39: r: 0–0.19 very weak, 0.2–0.39 weak, 0.40–0.59 moderate, 0.6–0.79 as strong and 0.8–1 very strong. Linear regression was used to explain the proportion of variance in functional performance explained by muscle strength and muscle quality. The data were analysed using SPSS 22.0 for Windows (SPSS, Inc., Chicago, IL, USA).
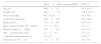
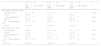
ResultsPhysical characteristics, body composition and functional performance of 50–70y women are displayed in Table 1. Functional performance classified per tertile of muscle strength and muscle quality are displayed in Table 2. Classified by muscle strength or muscle quality, those in the highest tertile (T1) had a higher functional performance across all tests than those in lowest tertile (T3) (p<0.05). Classified by tertile of muscle strength extended gait speed was different between those in the highest tertile, middle tertile and lowest tertile. Classified by tertile of muscle quality, those in the lowest tertile were different to those in the middle and highest tertile for extended gait speed and time taken to complete 5 chair rises. Those in the middle and highest tertile of muscle quality did not differ in functional capability.
Physical characteristics, body composition, muscle strength and functional performance in healthy 50–70y women.
| Mean±SD or median (IQR) | 95% CI | |
|---|---|---|
| Age (y) | 60.4±5.1 | 59.5–61.3 |
| Height (cm) | 162.7±5.5 | 161.8–163.7 |
| Body mass (kg) | 66.2 (13.5) | 64.8–68.1 |
| Lean tissue mass (kg) | 40.0±3.9 | 39.3–40.6 |
| Body fat (%) | 37.5±6.8 | 36.4–38.7 |
| Knee extensor torque (Nm/kg) | 1.3±0.4 | 1.2–1.4 |
| Muscle quality (Nm/kg) | 23.7±5.9 | 22.6–24.7 |
| 900m Gait speed (m/s) | 2.3±0.5 | 2.2–2.4 |
| 5 repetition chair rise time (s) | 8.4 (2.5) | 8.0–8.7 |
| Chair rises in 30s (n) | 17.2±4.1 | 16.2–18.2 |
Values are displayed as mean±SD, median (IQR) and 95% or Boostrap 95% confidence interval (CI).
Functional performance classified by tertile of knee extensor torque and muscle quality.
| T1 (n=42) | T2 (n=43) | T3 (n=43) | p | |
|---|---|---|---|---|
| Mean±SD or median (IQR) | Mean±SD or median (IQR) | Mean±SD or median (IQR) | ||
| Knee extensor torque (Nm/kg) | ||||
| Gait speed (m/s)a | 2.6±0.5 | 2.3±0.4 | 2.1±0.4 | <0.001 |
| 95% CI | 2.5–2.8 | 2.2–2.4 | 1.9–2.2 | |
| 5 Chair repetitions (s)b | 8.1±1.8 | 8.3 (2.1) | 9.4±2.3 | 0.006 |
| 95% CI | 7.5–8.6 | 7.6–8.7 | 8.8–10.2 | |
| 30s Chair repetitions (n)b,* | 19.0±4.6 | 16.8±3.3 | 15.6±3.6 | 0.020 |
| 95% CI | 17.0–21.0 | 15.4–18.2 | 13.8–17.4 | |
| Muscle quality (Nm/kg) | ||||
| Gait speed (m/s)c | 2.4 (0.7) | 2.4±0.4 | 2.1±0.2 | 0.001 |
| 95% CI | 2.3–2.7 | 2.2–2.5 | 2.0–2.3 | |
| 5 Chair repetitions (s)c | 8.0 (2.4) | 8.2±1.7 | 9.6±2.2 | 0.003 |
| 95% CI | 7.5–8.5 | 7.7–8.7 | 8.9–10.2 | |
| 30s Chair repetitions (n)b,* | 18.3±4.8 | 17.8±3.6 | 15.2±3.2 | 0.027 |
| 95% CI | 16.4–20.3 | 16.2–19.3 | 13.7–16.7 | |
Values are displayed as mean±SD or median (IQR) and 95% or Boostrap 95% CI. p=significance value for one-way ANOVA or Kruskall Wallis test.
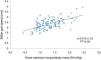
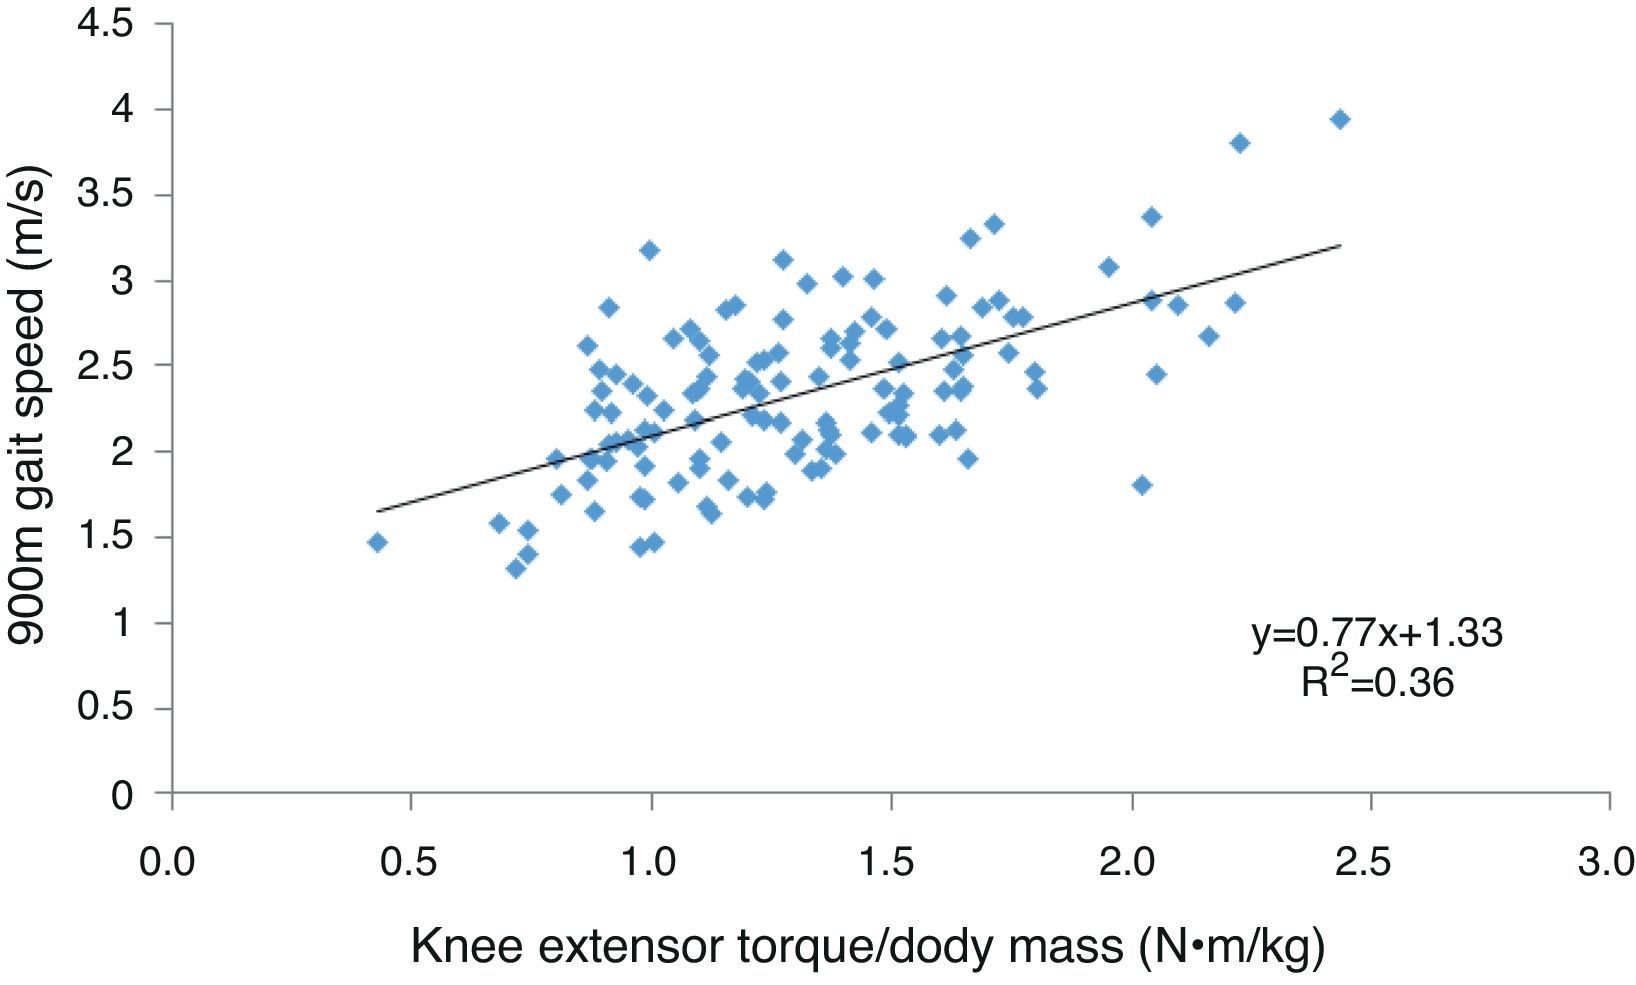
There was no association between upper leg LTM and functional performance (r=0.007–0.061, p>0.05). Muscle strength demonstrated a moderate association with extended gait speed (Fig. 1) and the number of chair rises undertaken in 30s and a weak association with the time taken to complete 5 chair rises (Table 3). Muscle strength was associated with all functional performance measures in the highest tertile and with gait speed and the number of chair rises completed in 30s in the lowest tertile but was not associated with functional performance in the middle tertile.
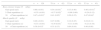
The association between knee extensor torque or muscle quality and functional performance for healthy 50–70y women (n=128) and per tertile.
| n=128 | T1 (n=42) | T2 (n=43) | T3 (n=43) | |
|---|---|---|---|---|
| Knee extensor torque (Nm/kg) | ||||
| Gait speed (m/s) | 0.60 (<0.01) | 0.54 (<0.01)* | 0.13 (0.40) | 0.46 (<0.01)* |
| 5 Chair repetitions (s) | −0.35 (<0.01) | −0.37 (0.02)* | −0.08 (0.60) | −0.24 (0.12) |
| 30s Chair repetitions (n) | 0.47 (<0.01)a | 0.41 (0.05)* | 0.20 (0.35) | 0.47 (0.04)* |
| Muscle quality (Nm/kg) | ||||
| Gait speed (m/s) | 0.40 (<0.01) | 0.27 (0.08) | 0.12 (0.45) | 0.24 (0.11) |
| 5 Chair repetitions (s) | −0.33 (<0.01) | −0.39 (0.01)* | −0.11 (0.48) | −0.21 (0.19) |
| 30s Chair repetitions (n) | 0.38 (0.01)a | 0.31 (0.13) | 0.04 (0.84) | 0.40 (0.08) |
Values are displayed as Pearsons or Spearmans r (p-value).
Muscle quality demonstrated a moderate association with extended gait speed and a weak association with both chair rise tests. Muscle quality was associated with the time taken to complete 5 chair rises in the highest tertile but was not associated with any other functional performance measure in any other tertile. Compared to muscle quality, muscle strength explained a greater proportion of the variance in extended gait speed (36% vs. 16%), the number of chair rises completed in 30s (22% vs. 15%) and the time taken to complete 5 chair rises (13% vs. 11%).
DiscussionCompared to muscle quality, knee extensor strength per kg body mass had a stronger association with functional performance and could better differentiate between those of high, intermediate and lower functional performance in healthy 50–70y women.
Interestingly, classified by tertile of muscle strength or muscle quality those in the highest tertile could be differentiated from those in the lowest tertile in terms of functional performance. It became more challenging to separate those in the middle tertile from those in the highest or lowest; in fact, only gait speed classified by muscle strength could provide this differentiation. Furthermore, knee extensor strength was associated with functional performance in the highest and lowest tertiles of muscle strength but muscle quality was generally not associated with functional performance in any tertile. The absence of an association between strength and functional performance in the middle tertile perhaps suggests a non-linear relationship between strength and functional performance. Buchner et al.40 reported an association between strength and gait speed (15.2m) in weaker participants but not in stronger participants. The authors suggested that small changes in physiological capacity of frail older adults, may lead to large changes in functional performance whereas small changes in physiological capacity of stronger adults, may lead to little or no change in functional performance. Our results suggest that this may be the case in the lowest tertile but also that small changes in strength for healthy adults in the highest tertile may lead to significant changes in functional performance. This has recently been demonstrated in well-trained distance runners who experienced an increase in running economy as a result of a strength training intervention.41 Buchner et al.38 may not have seen this effect at the higher end due to using a population based sample that allowed for participants with musculoskeletal conditions. These explanations whilst plausible need to be interpreted cognisant of the sample size used to derive the associations in each tertile (n=42–43).
As reported by Visser et al.,26 Hairi et al.5 and Hayashida et al.27 in older (≥65y) adults, we report muscle strength and quality to have a greater association with functional performance than muscle mass in healthy 50–70y women. However, compared to muscle quality, we report knee extensor strength corrected for body mass to have a stronger association with all functional performance measures. This suggestion has been supported by Hairi et al.5 when investigating the association between knee extensor strength and 6m gait speed and by Vilaça et al.25 using the 6min walk test in older (≥65y) adults. In our study, it is perhaps expected that as the difficulty of the test increases towards maximum so does the association between performance of the test and maximal voluntary knee extensor strength. Strength per unit LTM is considered to be an accurate representation of a muscles force generating capacity. The lower association between muscle quality and functional performance is perhaps because the upper leg LTM does not represent the body mass required to be elevated from a chair or accelerated during a gait speed test. Furthermore, we previously reported no difference in LTM between women in the 6th and 7th decade of life19 which may suggest that changes in muscle quality are a function of the underlying strength rather than mass.25,26 However, it must be acknowledged that we have used DXA to estimate LTM which has been shown to underestimate age-related change in skeletal mass compared to gold standard methods such as MRI and CT.42
Previously, Buchner et al.40 have reported lower extremity strength to account for ∼17–20% of short (<16m) gait speed tests in older adults (50–96y). To the authors knowledge, the 900m gait speed test is the first gait speed test reported in which >30% of the variance in performance among healthy older women can be explained by knee extensor strength. Our test which requires a similar time (∼6–7min) to complete as the 6min walk test is perhaps a step in the right direction toward the call for the generation of maximal gait speed reference values in healthy adults.25 The fact that lower extremity strength has a strong association with a maximal gait speed test which has a range of 1.3–3.9m/s is encouraging. This suggests that the relative muscular effort for those with the mean gait speed (2.3m/s) is considerably less when performing a habitual gait speed (∼1.4m/s) for extended periods of time. The relative effort required to perform tasks related to ADL could be a key determinant as to how long quality of live and independent living are preserved.
Our study makes a contribution to knowledge about the association between laboratory measures of LTM, muscle strength, muscle quality and functional limitation in healthy late middle aged20 adults who are not yet frail. The applicability of our study is limited by our small (n=128) convenience sample of healthy older women recruited from the University campus community and surrounding area. This may be especially important as education and socioeconomic status have been reported to influence the health status of a population.43 The mean habitual gait speed (1.4m/s) and dietary protein intake (1.2gkg−1BWday−1) of participants in the University of Limerick Healthy Aging Study demonstrate the relative physical and nutritional health of this cohort compared to more representative cohorts (dietary protein intake 0.8–1.1kg−1BWday−1 and habitual gait speed 0.8m/s)44,45 which may introduce a health bias. Furthermore, we did not assess cognitive function, stage of the menopause or control for habitual physical activity and as such it is unknown how these co-founding variables may have affected the associations reported.
Although 900m gait speed had the strongest association with muscle strength and quality, the self-selected mode of maximal gait speed which included walking, jogging or running may have over or underestimated our gait speed and therefore influenced the strength of the associations reported. Furthermore, endurance performance is also dependent on cardiorespiratory and muscle oxidative capacity which we did not control for. The associations reported for all muscle and functional performance parameters must be interpreted cognisant of the cross-sectional study design and therefore survival bias may have influenced the results.
ConclusionThe fact that strength measurement at a single time point has been shown to be predictive of mobility decline and11 that the lower limbs are most affected21,24 should make lower limb strength assessment a priority for researchers generating reference values for muscle health and clinicians in practice. As Dulac et al.46 have recently reported using handgrip strength, we report knee extensor strength normalised to body mass as an index that could provide a cost effective and simplistic measure of muscle health which could be used in a clinical setting and can represent a significant proportion of the variance in functional capacity. This may be useful to clinicians attempting to assess the functional capability of older adults in the community. By contrast our results suggest that muscle quality assessment, requiring expensive imaging technology may be of lesser value in relation to distinguishing functional performance. Further work is required to determine whether these differences remain when using MRI or CT to determine skeletal muscle mass.
Statement of human and animal rightsAll procedures performed in studies involving human participants were in accordance with the ethical standards of the institutional and/or national research committee and with the 1964 Helsinki declaration and its later amendments or comparable ethical standards.
Informed consentInformed consent was obtained from all individual participants included in the study.
Conflicts of interestThe authors declare no conflicts of interest.
The authors would like to thank the University of Limerick for funding this study, specifically the ‘Roadbridge Medical Research Scholarship’ which funded the authors PhD research. This study was also supported by Food for Health Ireland and Enterprise Ireland grant CC20080001.