


Identifying a weak/strong pelvic floor muscle (PFM) contraction in pregnant women may help prevent and treat dysfunctions during late pregnancy and postpartum.
ObjectiveTo determine whether the Peritron™ manometer can accurately differentiate a weak from a strong PFM contraction and the respective cut-offs for its variables in pregnant women.
MethodsThis is a diagnostic accuracy study. Forty-four women in the third trimester of pregnancy participated (mean±SD age: 29±5 years). The reference test was vaginal palpation, and the index test was vaginal manometry (Peritron™ manometer). Variables assessed by vaginal manometry were rest, maximal voluntary contraction (MVC), MVC average, duration, gradient, area under the curve (AUCm), and contraction speed. The Receiver Operating Curve (AUC/ROC) was used to analyze the data and obtain cut-off points for these variables.
ResultsPerfect discrimination (AUC=1.00) to differentiate between a weak/strong PFM contraction in pregnant women was observed for peak MCV (cut-off: 40.56 cmH2O). The MVC average showed excellent discriminative ability (AUC=0.96; cut-off: 30.66 cmH2O). The gradient variable (AUC=0.85; cut-off: 27.83 cmH2O/s) and AUCm (AUC=0.86; cut-off: 1315.6 cm²*s) showed a good discriminative ability.
ConclusionThe best variables to discriminate between weak/strong PFM contraction in pregnant women using vaginal manometry were peak MVC, MVC average, gradient, and AUCm.
The main purpose of evaluating the pelvic floor muscles (PFM) during the gestational period is to detect PFM dysfunctions during and after pregnancy. After vaginal delivery, the incidence of dysfunctions such as stress urinary incontinence,1 pelvic organ prolapse, and overactive bladder are associated with inadequate function of the PFM.2 Different characteristics such as strength, coordination, time of activation, and endurance may contribute to different PFM dysfunctions.3 The results from the PFM assessment contribute to a more accurate prescription of treatment strategies to manage PFM dysfunctions.4
Currently, the literature suggests that different methods should be applied to assess PFM function of pregnant women, including different characteristics of the muscles, as distensibility, strength,5,6 and/or contraction capacity.7 Among the methods indicated by the International Continence Society (ICS), vaginal palpation is one of the most used methods by physical therapists to assess PFM function and strength.8 In addition to vaginal palpation, the ICS recommends vaginal manometry, an objective method of evaluation that is considered valid,9,10 reliable,11 and minimally invasive. Unlike vaginal palpation, it allows the assessment of several variables during the PFM contraction, such as vaginal pressure during rest, the average variation in intravaginal pressure during a maximal voluntary contraction (MVC), duration of one contraction, and speed of muscles activation. Such variables might contribute to better assessment and assertiveness of a treatment prognosis.12 However, to our knowledge, no previous study has reported either the ability of the vaginal manometry to distinguish a weak from a strong PFM contraction in pregnant women or the cut-off points of its variables to classify PFM function of this population.
We found only one study that evaluated PFM strength after vaginal and cesarean delivery and established a cut-off of <20 cmH2O during a MVC to classify participants with a weak contraction13; however, the authors did not validate the cut-off point with a more elaborated statistical analysis. Thus, the present study aimed to determine whether vaginal manometry can accurately determine PFM strength of pregnant women and to analyze if the Peritron™ manometer can discriminate between women with a weak versus those with a strong PFM contraction and the respective cut-offs of its variables to discrimante between these groups. Therefore, the results from this study could help researchers and clinicians develop better strategies to help with prevention and/or treatment of disorders related to PFM in pregnant women.
MethodsStudy designThis is a diagnostic accuracy study from a secondary analysis, conducted according to the Standards for Reporting Diagnostic accuracy studies (STARD) guidelines, approved by the Ethics and Research Committee of the Federal University of São Carlos (CAAE: 14601719.7.0000.5504), following the Helsinki Declaration, conducted at the Federal University of São Carlos, Department of Physical Therapy, in Brazil.
ParticipantsForty-four women in the third trimester of pregnancy participated in this study between June 2017 and August 2018. All participants who agreed to participate in the evaluation signed an informed consent form. Women were invited to participate through social media, newspapers, flyers, websites, and radio. This study included primigravid women older than 18 years old, in the third trimester (between 28 and 41 weeks) of pregnancy, pregnant women with a single fetus, and with habitual risk (low risk), according to the American Academy of Pediatrics and the American College of Obstetricians and Gynecologists.14 The exclusion criteria included: the presence of lower limb motor or neurological deficit; previous pelvic or vaginal surgery; presence of pelvic organ prolapses that exceeded the vaginal opening. In addition, pregnant women who did not tolerate vaginal palpation; or had vaginal or urinary infection, or absence of a PFM contraction with vaginal palpation (Modified Oxford Scale-MOS equal to 0) were excluded.
Procedures and examinerInitially, one researcher (Examiner A), who was not involved with the PFM function assessment, performed a clinical interview. One semi-structured questionnaire was applied containing information related to age, gestational age (weeks and days), years of education, marital status, and one question to evaluate the presence of urinary incontinence ("Do you experience a urinary loss that occurs during physical effort such as coughing, sneezing, running?”15). Participants were instructed to answer this last question with a dichotomy answer: “yes” or “no”. A digital scale (Tanita BC-558 Ironman) was used to measure participants' weight. These anthropometric data (body mass and height) were used to calculate the body mass index (BMI) at the moment of the evaluation.
Then, a researcher (physical therapist) blinded to the clinical interview, with postgraduate qualification and with three-years of previous experience in PFM evaluation (B.M.R; Examiner B) conducted the PFM assessment. Before the data collection, Examiner B completed a training session conducted by one senior physical therapist, who is a specialist in Women's Health at the Brazilian Federal Council of Physical Therapy. Additionally, Examiner B conducted a pilot study that included three participants who were not included in the final statistical analysis to ensure consistency in the measurements.
PFM function assessmentPFM function was assessed by vaginal palpation and vaginal manometry, respectively. To evaluate PFM function, the participants were instructed to lie in a supine position, with hips and knees flexed and feet supported. The examiner used disposable gloves during the assessment. To perform the unidigital vaginal palpation, Examiner B added a lubricant gel to the index finger and inserted it into the participant's vaginal canal up to the second phalange. The reliability of the unidigital vaginal palpation was reported by a previous study and was considered substantial (k = 073).16
Initially, women were instructed on how to perform a PFM contraction voluntarily. Participants were instructed to contract their PFM as strongly as possible “if they were holding urine, with an inward and upward movement of the PFM”.17 Sequentially, they were instructed to relax the PFM completely. During the assessment, they were discouraged from contracting the abdomen and hip muscles.
PFM contraction was graded according to the MOS scale (0=absence of muscle function; 1=flicker/pulsation under the examiner's finger; 2=weak sustained contraction; 3=moderate contraction, positive cranial movement and compression of the examiner's fingers; 4= good contraction, positive movement toward the pubic symphysis and compression of the examiner's fingers; 5=strong contraction, positive movement toward pubic symphysis with strong compression of examiner's fingers).18 Each MVC was classified according to the MOS scale. Three MVCs were requested with one minute of rest between them, and the highest value was included in the statistical analysis.
After five minutes, PFM function was assessed by manometry using the Peritron™ manometer (Cardio Design Pty Ltd, Oakleigh, Victoria, Austrália). The reliability of the manometer has been considered moderate in pregnant women during the third trimester of pregnancy.19
During the assessment, the vaginal probe was protected with a non-lubricated condom and a neutral lubricant gel. The probe was inserted 3.5 cm inside the participant's vaginal canal (location with the highest pressure during a voluntary contraction)20 while the device was still off. Once the probe was positioned into the vaginal canal, the researcher pressed the power button to turn on the device and asked the participant to remain in a resting position without any voluntary contraction (either from PFM or from other muscles) and breathe normally. While participants remained at rest, the researcher recorded the manometer pressure without PFM contraction. Before the beginning of the assessment, the researcher calibrated the Peritron™ manometer by pressing the “power” button of the device.
The balloon inserted into the vaginal canal was connected to a hand microprocessor and recorded the Peritron™ manometer variables peak and average MVC in centimeters of water (cmH2O, scale ranging from 0 to 300 cmH2O) during PFM contraction. The other variables were registered in different units: duration (seconds), gradient (cmH2O/second), area under the curve assessed with manometry (AUCm) (cm2*s), and speed of muscles activation (cmH2O/seconds). These variables are described in Peritron's handbook and are presented in the Supplementary Material online.
To access the values of the variables, the examiner held the button named “3WTS” and released it as the variable's name appeared on the equipment display. By performing this procedure, the researcher automatically obtained the value of the most recent contraction measured by the device. To reset the device, the researcher pressed the “power” button. Three MVCs were measured, with one-minute rest between them and the mean value of the variables was used in the statistical analysis. Only contractions with visible inward and cranial movement of the balloon of the Peritron and minimal use of accessory muscles (hip adductors, gluteals, and/or abdominals)21 were considered. The contraction of the accessory muscles was assessed by visual inspection. The same verbal instructions used during vaginal palpation were repeated during the assessment with the manometer. To avoid probe movement during the MVC evaluation, the examiner maintained support with the thumb and index finger at the probe and followed the movement of the probe during the contraction.21
Statistical analysisSTATA and SPSS software version 21 (SPSS Inc., Chicago, IL) were used for the statistical analysis. Data were reported according to frequencies, percentages, means, and standard deviations.
To perform the statistical analysis related to the diagnostic accuracy and the discriminative validity of manometry, participants were divided into two groups according to the results from the unidigital vaginal palpation (reference test): 1) women with weak PFM contraction (1 or 2 in MOS) and 2) strong PFM contraction (≥3 in MOS). This classification followed previous literature that classified a score of ≥3 in MOS as a strong contraction,22 as the examiner is able to measure the cranial and ventral displacement associated with the closing of the vaginal introitus.23
We built the area under the curve (AUC) using the Receiver Operating Curve (ROC) for each manometry variables of interest. The largest AUC was considered to have greater accuracy in discriminating groups. The discriminative ability of the variables/models was classified as excellent (AUC = between 0.90 and 1.0); good (AUC = between 0.80 and 0.89); moderate (AUC = 0.70 to 0.79); poor (AUC = between 0.60 and 0.69); and worse than random (AUC ≤0.50).24
Cut-off points for each variable of interest were identified by analyzing sensitivity and specificity to determine a cut-off point that maximized both values (i.e., high values). In addition, the cut-off chosen should maximize the percentage of correctly classified patients.
We planned to conduct a multivariate regression analysis to identify which variable (including variables assessed by vaginal manometry and variables assessed by the semi-structured questionnaire) could best discriminate the quality of PFM contraction. However, this analysis could not be conducted as one variable assessed by manometry showed a perfect discriminate ability to differentiate a weak from a strong contraction in pregnant women.
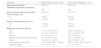
ResultsInitially, 45 pregnant women were assessed for eligibility. One participant was excluded because she felt uncomfortable with the probe during the manometry assessment and testing was interrupted. A flowchart of the study is shown in Fig. 1. The participants' mean age and standard deviation (SD) was 29 (SD=5) years old. At vaginal palpation, 57% (n = 25) of women presented a weak MVC according to the MOS (MOS 1 or 2), while 43% (n = 19) showed a strong PFM contraction (MOS≥3). Descriptive data regarding gestational age, gestational BMI, years of education, presence of stress urinary incontinence, and results from the vaginal manometry are available in Table 1.

Flowchart of the study.
Descriptive data of the sample (n = 44).
AUCm, area under the curve assessed with manometry; CI, confidence interval; PFM, pelvic floor muscles; SD, standard deviation.
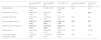
Table 2 shows the sensitivity, specificity, AUC analysis, and values defined as cut-off points for each variable of the Peritron™ manometer. The variable “peak MVC” had an AUC = 1.00, which means that this variable had a perfect ability to discriminate a strong or weak PFM strength in pregnant women. In addition, the variables AUCm and gradient variable had a good discrimination ability (AUC = between 0.80 and 0.89) and the duration variable had a moderate discrimination capacity (AUC = 0.73). Graphs are presented in Fig. 2. The remaining variables assessed by manometry (i.e., rest and speed of muscle activation) presented a poor or worse than random discrimination ability (AUC<0.70). Graphs are shown in Fig. 3.
Sensitivity, specificity, AUC and the cut-off points for vaginal manometry assessment.
| Sensitivity (95% CI) | Specificity(95% CI) | AUC (95% CI) | Correctly classified (%) | Cut-off (cm H2O) | |
|---|---|---|---|---|---|
| Rest (cmH2O) | 1.00 (0.84, 1.00) | 0 (0.00, 0.13) | 0.58 (0.40, 0.75) | 56.8 | 44.4 |
| Peak MVC* (cmH2O) | 1.00 (0.84, 1.00) | 0.72 (0.52, 0.85) | 1.00 | * | 40.6 |
| Duration (seconds) | 0.09 (0.02, 0.28) | 1.00 (0.86, 1.00) | 0.77 (0.63, 0.90) | 65.9 | 5.0 |
| MVC average (cmH2O) | 0.95 (0.77, 0.99) | 0.68 (0.48, 0.82) | 0.96 (0.91, 1.00) | 90.9 | 30.7 |
| Gradient (cmH2O/seconds) | 0.90 (0.71, 0.97) | 0.76 (0.56, 0.88) | 0.85 (0.73, 0.97) | 72.7 | 27.8 |
| AUCm (cm²*s) | 1.00 (0.84, 1.00) | 0.00 (0.00, 0.13) | 0.86 (0.74, 0.98) | 79.6 | 1315.6 |
| Contraction speed (cmH2O/seconds) | 0.09 (0.02, 0.28) | 1.00 (0.86, 1.00) | 0.58 (0.41, 0.75) | 56.8 | 1.2 |
AUC, area under the curve; AUCm, area under the curve assessed with manometry; CI, confidence interval; MVC, maximal voluntary contraction.

A ROC analysis with variables to predict a weak and a strong PFM contraction, according to the vaginal manometry. “MVC” had a perfect ability to discriminate a strong or weak PFM strength in pregnant women. Variables as AUCm and gradient had a good discrimination ability and the duration variable had a moderate discrimination capacity.
 showed a poor or worse than random discrimination ability (AUC<0.70).")
This study aimed to determine whether a vaginal manometer can accurately discriminate between women with a weak from those with a strong PFM contraction and the respective cut-offs of its variables to discriminate between these groups. Our results show which manometry variables are appropriate for assessing and classifying PFM function in pregnant women. Among the variables assessed automatically by the Peritron™ manometer, the peak MVC was the only variable that showed a perfect ability to differentiate between weak/strong PFM contraction (AUC = 1.00) in pregnant women. Moreover, the variable named MVC average showed an excellent discriminative ability and the variable gradient and AUCm presented a good ability to discriminate a weak from a strong PFM contraction. The rest and speed of contraction variables did not indicate a good ability to discriminate a weak contraction from a strong one because the specificity analysis did not demonstrate an effect.
According to the authors' knowledge, this is the first study to describe the diagnostic accuracy and discriminative validity related to vaginal manometry evaluation in pregnant women, as previous literature only reported the reliability of this device in pregnant women.19 Moreover, this is the first study that assessed other variables other than the peak value of the PFM contraction (MVC peak) by applying vaginal manometry in women during the gestational period. Previous studies19,25,26 reported the evaluation results including the peak of the MVC, not the average, gradient, duration, and other variables. Nonetheless, these variables are mentioned in the most recent update of the ICS about the terminology of PFM evaluation.27 These variables are related to different muscular properties of the PFM, such as the speed of muscle activation and time to reach the peak of the contraction, among others, which are also valuable when assessing the contraction of the PFM. Results from a more comprehensive evaluation that assesses more muscular properties could help to provide a better diagnostic of the status of the muscles, and provide insights into management strategies to prevent and treat PFM dysfunctions.
The present study identified the peak of the MVC as the best variable to correctly discriminate a weak/strong PFM contraction in pregnant women among all the variables calculated by the manometer. We could observe a consistency between our result and previous reports found in the literature,19,25,26 that considered the maximal peak among three MVCs or the mean of three MVCs in their statistical analysis, even not knowing that this could be the best variable to assess PFM function.
However, these studies did not use specific cut-off points to classify the PFM contraction of women. This is also a novelty of the present study that identified the discriminative values to correctly diagnose women with a weak/strong contraction of PFM. Reporting the cut-off points of the Peritron™ manometer might be interpreted as guidance to classify women that are assessed by vaginal manometry. As no previous study has been published with this purpose, we believe previous studies failed to classify participants with a weak/strong PFM contraction according to a specific cut-off point, and some mistakes could have occurred in interpreting the numerical values obtained during this assessment.
The results of the present study may be helpful for clinical practice, as applying an objective method of PFM function assessment may overcome the chances of errors that exist during assessments with subjective evaluation methods (such as vaginal palpation). In addition, disclosing these cut-off points may be a guide to objectively classify strong/weak contraction of the PFM in pregnant women. Therefore, health professionals could identify which women in the gestational period are more likely to present disorders related to the PFM currently or are at risk of developing it in the future (ie., urinary incontinence4), as 70% of women with pelvic floor dysfunctions cannot correctly perform a voluntary and strong PFM contraction.28 Therefore, it would be possible to prevent PFM dysfunctions during pregnancy and also during postpartum.
The strengths of this study are related to the use of a pre-established protocol to assess the PFM function of women during the gestational period, which included vaginal palpation, standardized voice command, and the Peritron™ manometer. Furthermore, this is the first study to describe the diagnostic accuracy related to the vaginal manometry evaluation of other variables in addition to the peak of contraction (MVC peak) in women during the gestational period.
The present study has some limitations, as the following: I) the evaluations were performed only in the third trimester of pregnancy and may not apply to women in the first and second trimester of pregnancy; II) although vaginal palpation could be questioned as a gold standard, as far as the authors' knowledge, there is no other available method that could be considered a “gold standard” to evaluate the contraction of the PFM.8 In addition, it is known that these two methods (i.e., vaginal palpation and manometry) are highly correlated,10 often used during clinical and scientific practice and indicated by the ICS.23,29 Additionally, the examiner had previous experience in PFM evaluation and completed prior training before data collection to reduce bias during the evaluation. III) The sample size was limited. However, this study was performed as a secondary analysis of the primary study. IV) The same researcher who performed the manometry assessment was aware of the results obtained during vaginal palpation. However, variables obtained from the manometry were automatically generated without the influence of the assessor; therefore, we believe that detection bias was minimal. V) We planned to perform a regression analysis to identify which variables (ie, from the vaginal manometry or the semi-structured questionnaire) could better discriminate PFM contraction. However, this analysis was not possible as we identified one variable that perfectly discriminated a weak/strong PFM contraction.
Future studies should investigate the diagnostic accuracy of vaginal manometry in different populations (healthy or women with incontinence) to clarify the ability of this method to distinguish the quality of PFM contraction. Moreover, future studies should investigate which variables (i.e., from the vaginal manometry or the semi-structured questionnaire) could better discriminate PFM function.
ConclusionsThe variable assessed by the Peritron™ manometer that perfectly discriminates between weak/strong PFM contraction in pregnant women was the peak of the MVC (AUC=1.00), with a cut-off point of 40.56 cmH2O. Moreover, the MVC average variable (cut-off point: 30.66 cmH2O) showed excellent ability to discriminate a weak/strong PFM contraction, followed by the gradient (cut-off point: 27.83 cm H2O/second) and the AUCm (cut-off: 1315.6 cm²*s) variables, that showed a good ability to discriminate a weak/strong PFM contraction.
This study was financed by the Coordination for the Improvement of Higher Education Personnel (CAPES), Finance Code 001.


