


Reliability studies have a long history in the physical therapy literature and their sophistication has evolved over the decades. Often, however, there has been incomplete reporting or a lack of coherence among study purpose, design, choice of analysis, sample size justification, and reporting of results. Two possible explanations for this oversight are a vaguely written purpose statement and statistical software that does not provide all essential information.
ObjectiveThe goal of this masterclass is to provide considerations and resources to assist investigators structure a coherent reliability study design and subsequent presentation of results.
DiscussionThis masterclass highlights the importance of framing a study purpose that clearly distinguishes between a hypothesis testing and parameter estimation study and appropriately labelling the study design. It also stresses the importance of stating whether the raters are the only ones of interest or whether they are intended to represent a larger group of raters, applying a sample size calculation consistent with the study purpose, and reporting results that align with the study purpose and design.
Reliability studies have had a long history in the physical therapy literature.1,2 These studies have primarily addressed inter-rater, test-retest, or a combination of the two designs. Early publications presented point estimates of intraclass correlation coefficients (ICCs)3 and later reports accompanied the ICCs with 95% confidence intervals (CIs).4 Near the end of the 20th century, the standard error of measurement (SEM) appeared with increased regularity,5 and by 2010 it was commonplace to find ICCs, their 95% CIs, and point estimates of SEMs included in many reliability studies of interest to physical therapists. Although there is a rich history of reliability studies in the physical therapy literature, often these studies have shown a lack of coherence among the purpose, design, appropriate choice of analysis, reporting, and interpretation of results. For example, reliability studies (1) rarely include a sample size calculation or exhibit coherence among the purpose statement, sample size calculation, and analysis;6–8 (2) occasionally apply an inappropriate ICC form that ignores a meaningful difference in mean scores between test and retest;8–14 and (3) have reported SEMs without including CIs even though ICCs are reported with CIs.9–13,15 We believe that vaguely written research questions and statistical software packages that do not provide all relevant analyses play important roles in contributing to the lack of coherence often seen in reliability studies. Better reporting standards including those advocated by the Consensus-based Standards for the Selection of Health Measurement Instruments group and Guidelines for Reporting Reliability and Agreement Studies (GRRAS) are required.16,17 The goal of this monograph is to provide considerations and resources to assist investigators structure a coherent reliability study design and subsequent presentation of results.
Before proceeding there are two essential points to acknowledge. First, reliability is not a property of a measure, but rather of a measure's scores or measured values.18,19 Messick states, “Tests do not have reliabilities and validities, only test responses do. This is an important point because test responses are a function not only of the items, tasks, or stimulus conditions but of the persons responding and the context of measurement.”18 The second point is that reliability is not an all-or-none property: it exists to a degree. Deciding about the adequacy of reliability in a specific context requires evaluating the extent to which measured values differentiate among the objects of measure (hereafter referred to as patients) and the absolute error expressed in the same unit as the original measurement. As pointed out by the GRASS group, tagging adjectives (e.g., poor, fair, moderate, substantial, almost perfect) to ICC values is not enough.17 Making a judgment based on both relative (ICC) and absolute (SEM) reliability coefficients is necessary. Having a firm understanding of these fundamentals will discourage investigators from presenting the often-seen concluding statement that declares a measure reliable, and the subsequent influence this authoritative pronouncement may have on readers.20,21
Framing the study purposeA clearly crafted purpose statement conveys the context and sets the stage for what is to follow in the design, sample size calculation, and analysis (Fig. 1). Too often vague verbs such as “to investigate”, “to examine”, and “to explore” are found in purpose statements.9,10,22 These verbs lack the specificity needed to allow the seamless transition from purpose statement to research question. Better verbs such as “to determine” and “to estimate”, for example, direct a reader's expectation towards hypothesis testing, where the study's obtained reliability coefficient will be formally compared to the hypothesized null value, or parameter estimation, where point and interval estimates (e.g., 95 % CI) for the likely location of the population's reliability value will be reported. If the goal is hypothesis testing, including null and alternate hypotheses further clarify the investigator's intent concerning the directionality of the subsequent statistical test (i.e., 1- or 2-tailed). Essential components of parameter estimation purpose statements include specification of the confidence level of interest (e.g., 95 % CI) and whether the interval of interest is 1- or 2-sided.
Hypothesis testing example
Purpose statement: The purpose of this study was to determine if the inter-rater reliability, as quantified by a Form 2,1 Shrout and Fleiss ICC (hereafter identified as ICC2,1),23 of the Chedoke Arm and Hand Activity Inventory (CAHAI)24 in patients post-stroke fulfilling the eligibility criteria exceeds 0.90.
Research Question: Does the inter-rater reliability, as quantified by a Shrout and Fleiss ICC2,1,23 of CAHAI24 scores from patients post-stroke fulfilling the eligibility criteria exceed 0.90? The answer to this clearly stated question will be either “Yes” or "No” as determined by the critical p-value (e.g., p < 0.05).
Null hypothesis: CAHAI test scores from patients post-stroke fulfilling the eligibility criteria will not demonstrate sufficient reliability for clinical application (ICC2,1 ≤ 0.90).25,26
Alternate hypothesis: CAHAI test scores from patients post-stroke fulfilling the eligibility criteria will demonstrate sufficient reliability for clinical application (ICC2,1 > 0.90).25,26
Parameter estimation examplePurpose statement: The purpose of this study was to estimate the inter-rater reliability of CAHAI scores as quantified by Shrout and Fleiss ICC2,1 and 2-sided 95% CI, in patients post-stroke fulfilling the eligibility criteria.
Research question: To what extent are rater assigned CAHAI scores reliable, as quantified by a Shrout and Fleiss ICC2,1 and 2-sided 95% CI, in patients post-stroke fulfilling the eligibility criteria? The answer to this question will be point and interval estimates of the ICC.
DesignTypical designs appearing in the physical therapy literature include intra-rater, inter-rater, test-retest, and a combination of rater and test-retest designs. An assumption for all reliability designs is that the feature being measured does not change during the course of the study: a patient's true score does not change. In this commentary we restrict our discussion to the frequently seen design where a single rating is obtained by either each rater in an inter-rater reliability study, or a single rating at each occasion in an intra-rater or test-retest reliability study.
Sample variability impacts the magnitude of an ICC. All else being equal, a sample with a larger variability—think a wider range of values—will have a higher ICC than a sample with less variability. For this reason it is critical that the sample is representative of the population of interest. This is an important consideration at two levels. First, it is important that the study patients are representative of those to whom the results will be applied. An ideal sampling strategy for reliability studies would be random sampling from a larger pool of individuals fulfilling the eligibility criteria. Often, however, this is not possible because investigators do not have access to a sufficient number of patients at a single point in time. When this is the case, consecutive sampling of patients fulfilling the eligibility criteria is a reasonable method for obtaining an unbiased sample.
When raters are involved in the measurement process, knowledge of their characteristics and who they are intended to represent is necessary. In addition to mentioning the raters’ experiences with patients similar to the study sample, and whether the raters have had training on the outcome measure, it is essential for an investigator to state whether the raters taking part in the reliability study are viewed as the only raters of interest, or whether they are intended to represent a larger group of raters. We will subsequently see in the analysis section that this distinction has an important implication for the choice of analysis of variance (ANOVA) model from which the ICC and SEM are obtained.
An example of a pure inter-rater reliability study design would be clinicians observing and scoring the same stimulus (e.g., CAHAI scores assigned to videotaped performances of a group of patients). An example, of a pure test-retest reliability study would be patients completing a self-report functional status measurement over an interval when no true change is believed to have occurred. Often however, owing to feasibility and the importance of providing a real-world context to the assessment process (i.e., video-taped ratings don't account for differences eliciting test results), a design that combines both inter-rater (or intra-rater) and test-retest reliability components (a patient provides separate performances or stimuli for each rater or occasion) is necessary. For example, a design where four raters independently administer and score the CAHAI would include variations between raters and patient's performances. Not only does an interpretive challenge arise when an investigator assigns the intra-rater, inter-rater, or test-retest label to the combined design, but the combined design has also led some investigators to apply a Form 3 ICC, for example, when a Form 2 ICC is more appropriate.8–13 We will elaborate on this peculiarity in the analysis section. For a combined design it may be more informative to comment on sources of variation (see Appendix for variance calculation) rather than assigning a procrustean label to the study design. For example, an investigator could state the following: “Our design has components of inter-rater and test-retest reliability. Accordingly, apparent differences among raters’ scores include both differences among raters and inherent variation in patients’ performances.”
Another important consideration in an inter-rater reliability study—either pure or combined design—is the potential effect the order of testing may have on the results. If the order of testing among raters were the same for all patients, it would be impossible to determine whether a systematic difference among raters was owing to a rater or the order of testing associated with that rater. Although some investigators have randomized the order of testing to raters, randomization alone does not ensure balance, particularly in reliability studies with relatively small sample sizes. The Latin Square design provides one remedy for addressing this concern.27 In a Latin Square design the order of testing is perfectly balanced among raters; an example is shown in Fig. 2. Notice that in this example each rater's assessment order precedes any other rater's order the same number of times.
Sample size estimationHypothesis testing sample size
Several sample size estimation methods exist for hypothesis testing reliability studies,25,26,28 one of which is illustrated below.28 Before proceeding it is important to acknowledge that the distribution of reliability coefficients is non-normal. Accordingly, the first step in a sample size calculation is to transform the expected and null reliability coefficient values to a distribution that approximates a normal distribution. This is accomplished with Fisher's Z-transformation.29 The expected reliability (RE) is what an investigator anticipates finding in the study, and the null reliability value (R0) is that specified in the null hypothesis statement.
Fisher's Z-Transformation of expected reliability value RE

Fisher's Z-Transformation of null reliability value R0
where ln is the natural logarithm and k is the number of repeated measurements (raters or occasions)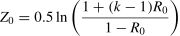
The transformed Z-values are then applied to the following sample size formula which is based on a 1-way ANOVA model.28 Estimates from this model will be conservative when a two-way model is applied.
where k, ZE, and Z0 have been defined previously, and ZαandZβ represent the standard normal deviates for Type I and Type II errors respectively. For a Type I error of 0.05 and a Type II error of 0.20 these Z-values would be 1.64 (1-tailed owing to the directional hypotheses) and 0.84, respectively.Parameter estimation sample size 2-sided confidence interval
Often investigators are interested in gaining an impression of a reasonable range of values in which the population reliability coefficient is likely to lie. When this is the case a 2-sided CI is desirable and can be estimated as follows30
where Zα/2is 1.96 for a 2-sided 95% CI; k is number of raters, occasions, or trials; w is the CI width; RE is the expected ICC value.Analysis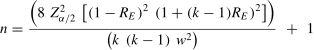
Given the importance of context specificity, it is essential to report patients’, and when applicable, raters’ descriptive characteristics.16,17 Also, summary statistics describing rater or occasion mean values is necessary as they communicate in familiar units the extent to which a systematic difference among raters or between occasions exists.
For a test or measure to be clinically useful, it must have a sufficiently high ICC and a sufficiently low SEM. What constitutes “sufficient” will be context specific. Accordingly, reporting parameter estimates, or hypothesis test results of both the ICC and SEM are essential. Information necessary to calculate ICCs and SEMs is obtained from ANOVA tables. Form 1 ICCs and their corresponding SEMs are calculated from a 1-way ANOVA model, and Forms 2 and 3 ICCs and their related SEMs are calculated from a 2-way ANOVA model.
Intraclass correlation coefficientsMany popular statistical software packages provide hypothesis testing and CI options for ICCs. This is fortunate because the calculations required to determine the appropriate degrees of freedom are extensive and detailed by Shrout and Fleiss.23 In addition to the formulae provided by Shrout and Fleiss, CIs can also be estimated using a bootstrap procedure where sampling with replacement is applied and is appropriate when the statistical distribution is unknown or the assumption of normality is not satisfied.31
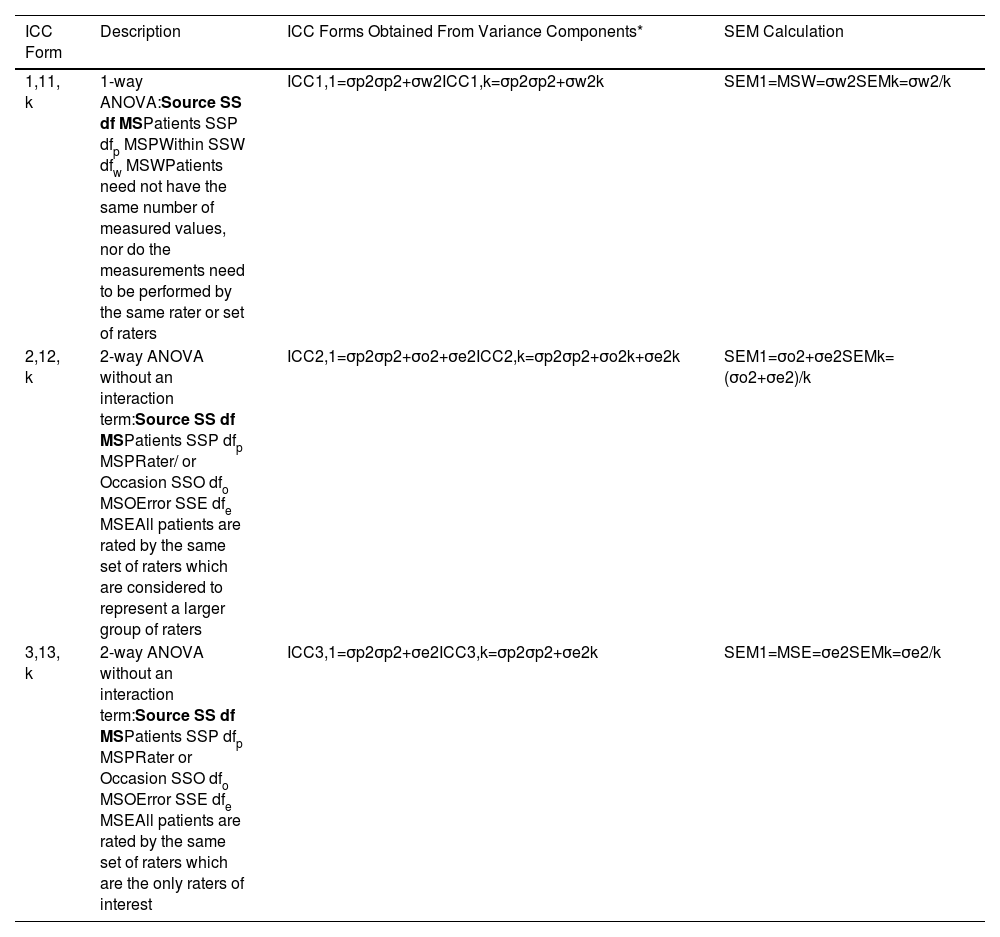
Although there are many forms of ICCs,32,33 we will restrict our discussion to those presented by Shrout and Fleiss where each rater (or each occasion in a test-retest design: our words) provides only a single measured value per patient.23 In their seminal article, Shrout and Fleiss introduced six forms of ICCs in the context of an inter-rater reliability study (Table 1).23 To assist investigators in choosing among these ICC forms, Shrout and Fleiss posed the following three questions: (1) “Is a one-way or two-way ANOVA model appropriate for the analysis of the reliability study?” (2) “Are differences between judges’ (or occasions: our words) mean ratings relevant to the reliability of interest?” (3) “Is the unit of analysis an individual rating or the mean of several ratings?”23
ANOVA models, ICC forms, and SEM calculations.
Terms mentioned in the table.
SS sum or squares.
df degrees of freedom.
MS mean square.
σp2 is the patient variance.
σw2 is the within patient variance.
σo2 is the rater or occasion variance.
σe2 is the error variance.
k is the number of measurements averaged.
ICC intraclass correlation coefficient.
SEM standard error of measurement.
A Form 1 ICC is appropriate when there is no natural structure linking repeated measurements and it is rarely misapplied. For example, different patients are assessed by different combinations of raters. However, making the appropriate choice between a Form 2 and Form 3 ICC has been challenging for some investigators, particularly when the design combines intra-rater or inter-rater, and test-retest components.8–13 We believe the source of the problem lies in the investigators’ applications of a pure rater design (i.e., Shrout and Fleiss’ illustration) to that of a combined design. To better understand the source of the problem it is informative to compare the Forms 2 and 3 ICCs shown in Table 1. The salient feature is that although both forms are based on a 2-way ANOVA model, the denominator of the Form 2 ICC calculation includes the variance component associated with a systematic difference among repeated measurements, whereas the Form 3 ICC excludes this variance component. Therefore, when a systematic difference among repeated measurements exists, the Form 2 ICC will be less than the Form 3 ICC. We will subsequently see that this also impacts the SEM calculation. We provide three examples to provide clarity when choosing between Forms 2 and 3 ICCs.
Example 1 When a reliability study has a test-retest component where patients’ performances are obtained for different trials or occasions, it is important to know whether a systematic difference exists. Accordingly, a Form 2 ICC is appropriate regardless of whether the same rater plays a meaningful role in obtaining the measured value or not.
Example 2 A Form 2 ICC is appropriate when reporting a pure inter-rater (or intra-rater) design where the raters are intended to represent a larger group of raters.
For example, an investigator is interested in estimating the inter-rater reliability and determining whether a systematic difference among raters is likely following a standardized training program for the CAHAI. The investigator is interested in generalizing the results to all raters who take part in future standardization training programs. Thus, knowing the extent to which a systematic difference is likely to occur in the population is important not only for the current investigator, but also to a wider audience.
Example 3 A Form 3 ICC is appropriate when reporting a pure inter-rater (or intra-rater) design where the reliability study raters are the only raters of interest.
A team of investigators will be undertaking a randomized clinical trial to evaluate two rehabilitation programs for patients post-stroke. The CAHAI will be the primary outcome measure, and it will be administered by four raters who have been hired for this project. In the clinical trial, each patient will be assessed pre- and post-intervention by one rater. Although it would be ideal to have both assessments performed by the same rater, the investigators believe it is possible that for some patients different raters will perform the pre- and post-assessments in the subsequent clinical trial. In the reliability study each patient is assessed by all four raters. Because the reliability study raters are also the same and only raters performing the assessments in the subsequent clinical trial, a Form 3 ICC is appropriate. The reasoning is that if a systematic difference is identified in the reliability study, for example, Rater 3′s mean rating is 4-points more than the other raters, the investigator can correct for this bias for all of Rater 3′s rating by subtracting 4-points. Accordingly, the systematic rater variance in the reliability coefficient calculation is effectively reset to zero and can be removed from the ICC calculation. The Form 3 ICC is appropriate.
Standard errors of measurementAlthough it is now customary to include point estimates of the SEM in reliability studies, they are rarely accompanied by a CI. A likely explanation is that many statistical software packages do not provide these results. However, estimates of the SEM and 95% CI can be obtained by applying the information shown in Table 1 and the following formula5,34:
where SSE is the sum of squares within or error from a 1-way or 2-way ANOVA respectively. χ1−α/22 and χα/22 are the chi-square values associated with the lower and upper confidence limits of interest, and dfe is the degrees of freedom for the error term from the appropriate ANOVA model.Summary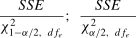
The goal of this monograph was to provide considerations and resources to assist investigators design reliability studies and report their results in the physical therapy literature. This work is based on existing guidelines16,17 and our review of published reliability studies, where frequently seen limitations included vaguely written purpose statements, mislabeling of study designs, not reporting whether raters were intended to represent a larger group of raters or the only raters of interest, failure to provide appropriate sample size calculations, application of inappropriate ICC forms, and not reporting CIs for the SEMs. In closing we propose that the most important consideration is to provide a clear and specific purpose statement and to ensure that each step of the design and subsequent reporting is true to this statement.
None.
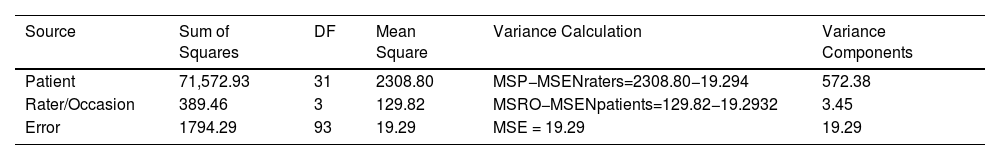
Variance Components and ICCs
In this example four raters independently administered and scored the CAHAI on 32 patients fulfilling the study's eligibility criteria. The order of testing was balanced among raters. Accordingly, apparent differences among raters also includes inherent differences within a patient's performance across the four occasions.
Summary Statistics by Rater
ANOVA and Variance Calculations


