

Investigating the influence of sensory processing disorders on the level of function of children with cerebral palsy (CP) may help therapists identify specific impairments that impact activity and participation in these children. This may provide direction on selection of interventions to improve function and quality of life.
ObjectivesTo investigate if sensory processing disorders in children with CP levels I and II on the Gross Motor Function Classification System (GMFCS) are associated with activity performance.
MethodsSensory processing and activity performance of 28 children with CP between 5 and 15 years (mean ± standard deviation; 9.9 ± 3.2 years) were evaluated using the Sensory Profile (SP) and Pediatric Evaluation of Disability Inventory (PEDI), respectively. Associations between the components of the SP and PEDI were assessed with Spearman correlation coefficients. Multiple linear regression analysis using backward stepwise method was used to determine the variables of sensory processing that are associated with activity performance on the PEDI.
ResultsThe category of Behavioral Outcomes of Sensory Processing was the only variable associated with Functional Abilities in self-care and social function (r2 = 0.30 and r2 = 0.39, respectively) and Caregiver Assistance (r2 = 0.36 and r2 = 0.37, respectively), (p < 0.05).
ConclusionSensory processing in children with CP levels I-II on the GMFCS is associated with their ability to perform daily living activities and in their social interaction with the environment.
Neuromotor dysfunctions in children with cerebral palsy (CP) create disorders of posture and movement,1 constraining their level of function,2,3 which impacts activities and participation performance.4–6 Previous studies addressing functional deficits in children with CP, reported that muscle strength, trunk control, and postural stability are important factors affecting activity performance.7–9 But, functional deficits in individuals with CP might also be related to deficits in sensory processing, defined as impairment in multisensory integration, necessary to provide adaptive responses to environmental demands.10,11
There is a high incidence of sensory processing impairments in children with CP.10,12–14 According to Tsao et al.11 white matter injury is present in about 45% of image scans of children with CP. These white matter lesions might have secondary effects on the development of cortical and thalamic regions, responsible for sensory processing.15,16 Sensory processing deficits frequently coexists with motor impairments,14 resulting in motor disorders.17 Sensory information guides action,18,19 as sensory inputs are captured and centrally processed11,20 to provide information and feedback about body position in space, allowing the formulation of adaptive responses.19,21
The majority of studies addressing sensory processing in children with CP use sophisticated neuroimaging equipment,10,11,15 which are not widely available in clinical settings. The use of clinical measures to assess sensory processing in children with CP is still not common.13 We found only two studies addressing sensory processing in children with CP using clinical measures such as the Sensory Profile.13,14
The use of clinical measures to assess sensory processing allows us to evaluate abilities and behaviors associated with processing functions of registration, modulation, and integration of sensory afferents22,23 providing a broad and comprehensive assessment of sensory processing deficits. Clinical measures, such as the Sensory Profile,24 provide a global evaluation of the way children interacts with the environment and respond to different sensory inputs, characterizing outcome patterns of the children and providing a useful guide for families to deal with sensory processing deficits.23,25
Therefore, considering the role of sensory information and its processing on motor control,19,26 as well as the high incidence of sensory processing impairments in children with CP,10,11,13 it might be possible that sensory processing impairments affects activity performance in this population. Previous studies have identified sensory processing dysfunction in CP,10,11 which emphasizes the importance of sensory processing for motor function.11,14 Nevertheless, to our knowledge, there is no study investigating the impact of sensory processing on functioning using clinical measures.
Therefore, the aim of the present study was to investigate if sensory processing in children with CP levels I and II on the Gross Motor Function Classification System (GMFCS) is associated with activity performance assessed by the Pediatric Evaluation of Disability Inventory (PEDI). Our hypothesis was that some components of sensory processing, tested by the Sensory Profile instrument, might be associated with activity performance in these children.
MethodsParticipantsThe present study is an exploratory study with a cross-sectional design with a sample of convenience. All participants were recruited from children rehabilitation centers. The inclusion criteria were: (a) children regularly treated in physical rehabilitation programs during the last six months; (b) presenting CP levels I or II on the GMFCS; (c) lower limb muscle tone classified as 0 (no increase in muscle tone) or 1 (slight increase in muscle tone) according to the modified Ashworth Scale, which ranks spasticity based on six levels27; (d) ability to follow simple commands; (e) absence of attentional problems or a diagnosis within the Autism Spectrum Disorders. The muscle tone and level of motor impairment were evaluated by a senior physical therapist with experience in neuropediatrics.
We excluded children who had been treated with neurochemical blocks in the previous six months or had orthopedic surgeries in the last year. Children with visual and auditory deficits were also excluded from the study. Legal guardians responsible for the children provided a written consent form after receiving written information about the experimental procedures. This study was approved by the local Ethics Committee (CAAE 17495213.8.0000.5504) from Universidade Federal de Sao Carlos (UFSCar), Sao Carlos, Sao Paulo, Brazil.
ProceduresAfter parents or guardians were contacted and invited to participate in the study, an appointment was scheduled with the primary caregiver to assess sensory processing and function of the children. All evaluations were performed by the same examiner, who was an experienced physical therapist previously trained in the application of the instruments used in this study. Intra-rater agreement, using intraclass correlation coefficients (ICC), previously determined using a group of 10 children with CP assessed on two occasions within a five-day interval, was 0.94 for the Sensory Profile and 0.85 for the PEDI.28
Sensory processing evaluationThe Sensory Profile questionnaire29 was used to evaluate sensory processing in children with CP. This questionnaire is a standardized parent-reporting measure that documents the responses of children to sensory events. This questionnaire quantifies behaviors associated with sensory processing dysfunction and provides a tool for consistent measurement of parental perception of these behaviors.
The Sensory Profile questionnaire is composed of 125 items representing 14 different domains of sensory processing. Parents or caregivers are interviewed to assess the children’s behaviors with answers using 5 different levels ranging from “always” to “never”. Six domains address sensory processing areas: Visual Processing, Auditory Processing, Touch Processing, Vestibular Processing, Oral Sensory Processing, and Multi-Sensory Processing. Five domains address sensory modulation: Modulation of Movement Affecting Activity Level, Modulation Related to Body Position and Movement, Modulation of Visual Input Affecting Emotional Responses, Modulation of Sensory Input Affecting Emotional Responses, and Sensory Processing Related to Endurance/Tone. The remaining three domains reflect social–emotional responses related to sensory processing: Behavioral Outcomes of Sensory Processing, Emotional/Social Responses, and Thresholds for Responses. The instrument also provides nine different Sensory Profile Factor domains representing styles of sensory processing: Sensory Seeking, Low Endurance/Tone, Emotional Reactivity, Inattention/Distractibility, Oral Sensory Sensitivity, Sensory Sensitivity, Poor Registration, Fine Motor/Perceptual, and Sedentary.
In addition to the scores for each domain, results of the Sensory Profile questionnaire can be interpreted based on a normative score, categorizing the child in each domain as being “typical performance” (within 1 standard deviation from the mean), “borderline” (between 1 and 2 standard deviations below the mean), or “atypical difference” (more than 2 standard deviations below the mean). For data analysis purposes, we used the categories of the normative scores.
Although we have not found studies testing psychometric properties of the Sensory Profile questionnaire for children with CP, the instrument is considered appropriate for this population.29
Evaluation of activity performanceThe PEDI30 is a standardized questionnaire validated for the Brazilian population, which assess children's activity performance. The PEDI measures activity based on tasks commonly performed by children during daily activities. It also measures activity by assessing the children’s dependence on a caregiver.
The questionnaire is administered through a structured interview of the parents or caregivers. Better activity performance is expressed by higher total scores. Normative scores can only be calculated for children up to 7.5 years of age, because this is the upper limit age addressed by the PEDI. However, the participants of the present study had functional skills that matched the expected performance for children around the age limit, thus allowing the use of PEDI in the tested age range, using the raw scores for each participant 8.
The PEDI tests three domains of activity performance. The first domain addresses children’s Functional Abilities in areas of self-care, mobility, and social function. In each of the 197 tested items the scores range from 0 (when the child does not perform the task) to 1 (when the child performs the task). The second domain tests Caregiver Assistance in the same areas addressed by the first domain (self-care, mobility, and social function). In this section, each item is scored on an ordinal scale from 0 (need of maximum assistance) to 5 (independence). The sum of the scores yielded a total raw score for each area of functional abilities. The third domain provides information about the necessary modifications to functional performance in the previously described areas. This later section was not used in the present study.
Thus, for the present study, only data from Functional Abilities in the areas of: self-care (Functional Abilities self-care - FAsc), mobility (Functional Abilities mobility - FAmob), and social function (Functional Abilities social function - FAsf) and Caregiver Assistance in the areas of: self-care (Caregiver Assistance self-care - CAsc), mobility (Caregiver Assistance mobility - CAmob), and social function (Caregiver Assistance social function - CAsf)30 were used for the three domains.
Data analysisWe presented the scores on the PEDI domains we analyzed (Functional Abilities and Caregiver Assistance) using descriptive statistics (means and standard deviations) for each of the 14 Sensory Profile domains in each of the Sensory Profile Categories. The normal data distribution was confirmed with the Shapiro Wilk test. We initially tested association between variables on the PEDI domains and Sensory Profile categories. This initial analysis was used to find significant moderate and strong correlations between the Sensory Profile categories and PEDI domains, which further guided the regression analysis. Correlations were tested using Spearman correlation coefficients. The coefficients were interpreted using the following guidelines: 0.26 to 0.49 is low, 0.50 to 0.69 is modest, 0.70 to 0.89 is high, and 0.90–1.00 is very high.9 Multivariate linear regression analyses only included those variables that had at least modest correlation (i.e. r ≥ 0.50).
Multivariate linear regression analyses were used to investigate whether Sensory Profile domains (independent variables) were associated with PEDI domains (i.e. dependent variable) using a backward stepwise method to obtain the model that minimized the Akaike Information Criterion. We choose a backward stepwise method, because it relies on the computer selecting variables based upon mathematical criteria. The models derived by the computer algorithm often take advantage of random sampling variation and so decisions about which variables should be included is based upon slight differences in semi-partial correlations.31
The PEDI domains showing at least modest significant association (r ≥ 0.50) with Sensory Profile domains were used to create five separate regression models. In the separate regression models, the raw scores for five PEDI domains (FAsc, FAsf, CAsc, CAsf, and CAmob) were included as dependent variables and Sensory Profile’s scores for the domains (Inattention/Distractibility, Fine Motor/Perceptual, and Behavioral Outcomes of Sensory Processing) were included as independent variables in each of the models. FAmob was not included in the regression model because it did not show at least moderate correlation with any Sensory Profile's variables. The categorized variables of the Sensory Profile were used in the analysis (1- typical; 2 - borderline; 3 - atypical).
Tests for multicollinearity among predictor variables were applied. Then, the Variance Inflation Factor (VIF) and tolerance statistics were examined and showed absence of collinearity within our data. All the assumptions to run a multivariate linear regression analyses were satisfied, ensuring the suitability of the model31: coefficient of regression significantly different from zero, F values greater than 1, and statistical significance in variance analysis (ANOVA) indicating the model significantly adheres to the data. By adopting the backward stepwise method, the independent variables which do not fit the model were automatically excluded from the final model.
The significance level α was set at p < 0.05. All statistical analyses were performed using SPSS software (version 17.0).
ResultsWe initially invited parents of 45 children with CP to participate in the study. From these invited parents, only 28 returned a signed informed consent. Thus, 28 children (16 males and 12 females) aged between five and 15 years old (mean ± SD; age: 9.9 ± 3.2 years; weight: 32.3 ± 13.1 kg; height: 132.4 ± 31.8 cm) participated in the study. All of them had spastic CP (18 hemiplegic and 10 diplegic impairment) with GMFCS level I (18 children) or II (10 children).
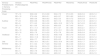
Average scores and standard deviations on the PEDI, according to the classification of Sensory Profile domains for (1) sensory processing areas; (2) sensory modulation; (3) social–emotional responses related to sensory processing; and (4) sensory profile factor, are presented in Tables 1–3.
Children’s scores on the PEDI for each Sensory Profile domain of sensory processing areas in each of the Sensory Profile categories.
| Sensory ProfileDomains in Sensory Processing Areas | Sensory ProfileCategories (n) | PEDIFAsc | PEDIFAmob | PEDIFAsf | PEDICAsc | PEDICAmob | PEDICAsf |
|---|---|---|---|---|---|---|---|
| Visual | TP = 13 | 63.8 ± 8.2 | 61.2 ± 3.8 | 52.4 ± 7.5 | 37.3 ± 3.5 | 34.8 ± 0.4 | 22.8 ± 1.4 |
| BD = 10 | 57.2 ± 8.4 | 60.8 ± 3.1 | 44.2 ± 9.7 | 33.5 ± 6.2 | 34.9 ± 0.3 | 21.5 ± 2.1 | |
| AD = 5 | 58.8 ± 9.9 | 56.8 ± 6.3 | 56.2 ± 3.3 | 33.4 ± 7.2 | 33.6 ± 2.6 | 23.4 ± 1.5 | |
| Auditory | TP =10 | 60.9 ± 8.8 | 58.4 ± 5.5 | 52.7 ± 7.4 | 35.8 ± 4.4 | 34.1 ± 1.9 | 22.8 ± 1.3 |
| BD = 8 | 57.7 ± 9.3 | 60.0 ± 3.8 | 48.9 ± 12.2 | 33.7 ± 7.8 | 34.7 ± 0.5 | 22.3 ± 2.5 | |
| AD = 10 | 62.1 ± 9.9 | 62.2 ± 2.4 | 48.6 ± 8.3 | 35.7 ± 4.9 | 35.0 ± 0 | 22.2 ± 1.8 | |
| Touch | TP = 8 | 61.1 ± 11.1 | 58.5 ± 6.5 | 57.1 ± 4.7 | 35.1 ± 6.6 | 34.0 ± 2.1 | 23.0 ± 1.7 |
| BD = 10 | 60.2 ± 8.6 | 60.5 ± 3.0 | 47.2 ± 10.1 | 35.0 ± 5.8 | 34.9 ± 0.3 | 22.1 ± 2.1 | |
| AD = 10 | 60.5 ± 7.9 | 61.5 ± 2.9 | 47.5 ± 7.8 | 35.6 ± 4.6 | 34.8 ± 0.4 | 22.3 ± 1.6 | |
| Vestibular | TP = 4 | 60.8 ± 11.4 | 60.0 ± 3.2 | 45.8 ± 14.6 | 33.5 ± 7.9 | 34.5 ± 0.6 | 21.5 ± 3.1 |
| BD = 7 | 60.3 ± 11.2 | 58.9 ± 6.5 | 51.9 ± 6.6 | 35.1 ± 7.2 | 34.0 ± 2.2 | 22.0 ± 1.4 | |
| AD = 17 | 60.6 ± 7.7 | 60.9 ± 3.4 | 50.5 ± 8.5 | 35.7 ± 4.2 | 34.9 ± 0.3 | 22.8 ± 1.6 | |
| Oral Sensory | TP = 13 | 59.3 ± 10.1 | 58.2 ± 5.1 | 50.0 ± 10.4 | 34.0 ± 6.6 | 34.3 ± 1.7 | 21.9 ± 2.2 |
| BD = 10 | 61.1 ± 9.4 | 61.7 ± 2.9 | 50.2 ± 8.8 | 35.4 ± 4.8 | 34.8 ± 0.4 | 22.9 ± 1.4 | |
| AD = 5 | 62.8 ± 3.4 | 62.8 ± 1.3 | 50.4 ± 6.5 | 38.2 ± 1.6 | 35.0 ± 0.0 | 22.8 ± 1.1 | |
| Multisensory | TP = 6 | 66.2 ± 9.7 | 61.0 ± 5.0 | 55.3 ± 8.8 | 38.0 ± 4.8 | 34.7 ± 0.5 | 23.5 ± 1.0 |
| BD = 4 | 59.3 ± 7.6 | 60.5 ± 3.3 | 47.8 ± 7.3 | 36.0 ± 1.6 | 35.0 ± 0.0 | 21.8 ± 1.7 | |
| AD = 18 | 59.0 ± 8.4 | 60.0 ± 4.4 | 48.9 ± 9.1 | 34.2 ± 6.0 | 34.5 ± 1.4 | 22.2 ± 1.9 |
Data are means ± standard deviation. Abbreviations: PEDI: Pediatric Evaluation of Disability Inventory; FAsc: Functional Abilities self-care; FAmob: Functional Abilities mobility; FAsf: Functional Abilities social function; CAsc: Caregiver Assistance self-care; CAmob: Caregiver Assistance mobility; CAsf: Caregiver Assistance social function; TP: typical performance; BD: borderline; AD, atypical difference.
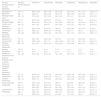
Children’s scores on the PEDI for each Sensory Profile domain of sensory modulation and social–emotional responses in each of the Sensory Profile categories.
| Sensory ProfileDomains in Sensory Modulation | Sensory ProfileCategories (n) | PEDIFAsc | PEDIFAmob | PEDIFAsf | PEDICAsc | PEDICAmob | PEDICAsf |
|---|---|---|---|---|---|---|---|
| Modulation of Movement affecting Activity Level | TP = 11 | 59.9 ± 10.3 | 58.1 ± 5.8 | 52.3 ± 5.6 | 34.3 ± 5.3 | 34.1 ± 1.9 | 22.6 ± 1.6 |
| BD = 7 | 64.9 ± 6 | 62.5 ± 2.8 | 53.9 ± 7.7 | 39.0 ± 2.9 | 34.9 ± 0.4 | 23.1 ± 1.1 | |
| AD = 10 | 57.8 ± 8.6 | 60.7 ± 2.4 | 45 ± 10.8 | 33.1 ± 6 | 34.9 ± 0.3 | 21.7 ± 2.3 | |
| Modulation Related to Body Position and Movement | TP = 2 | 62.5 ± 6.4 | 63.5 ± 0.7 | 47 ± 8.5 | 37.6 ± 2.1 | 35 ± 0 | 22.5 ± 0.7 |
| BD = 5 | 63.4 ± 8.8 | 60.4 ± 3.6 | 51.4 ± 9.8 | 38.2 ± 4.4 | 34.8 ± 0.4 | 22.8 ± 1.3 | |
| AD = 21 | 59.7 ± 9.2 | 60 ± 4.6 | 50.1 ± 9.2 | 34.3 ± 5.7 | 34.5 ± 1.3 | 22.3 ± 2.0 | |
| Modulation of Visual Input Affecting Emotional Responses | TP = 2 | 55.5 ± 13.4 | 57.5 ± 0.7 | 38 ± 17 | 29.9 ± 9.9 | 34.5 ± 0.7 | 20 ± 4.2 |
| BD = 4 | 68.5 ± 3.3 | 63.8 ± 0.5 | 54 ± 6.8 | 39 ± 1.2 | 35 ± 0 | 22.5 ± 1.9 | |
| AD = 22 | 59.6 ± 8.6 | 59.9 ± 4.5 | 50.5 ± 8.1 | 35.1 ± 5.2 | 34.5 ± 1.3 | 22.6 ± 1.5 | |
| Modulation of Sensory Input Affecting Emotional Responses | TP = 6 | 62.7 ± 8.3 | 60.5 ± 4.6 | 55 ± 5.5 | 37.0 ± 3.3 | 34.8 ± 0.4 | 23 ± 1.8 |
| BD = 3 | 53.3 ± 10.2 | 57 ± 1.0 | 39.3 ± 12.2 | 30.7 ± 7.6 | 34.7 ± 0.6 | 20.3 ± 3.1 | |
| AD = 19 | 61.1 ± 8.7 | 60.7 ± 4.4 | 50.3 ± 8.2 | 35.4 ± 5.5 | 34.5 ± 1.4 | 22.6 ± 1.4 | |
| Sensory Processing Related to Endurance/Tone | TP = 0 | 0 ± 0 | 0 ± 0 | 0 ± 0 | 0 ± 0 | 0 ± 0 | 0 ± 0 |
| BD = 0 | 0 ± 0 | 0 ± 0 | 0 ± 0 | 0 ± 0 | 0 ± 0 | 0 ± 0 | |
| AD = 28 | 60.5 ± 8.8 | 60.2 ± 4.2 | 50.1 ± 8.9 | 35.2 ± 5.4 | 34.6 ± 1.1 | 22.4 ± 1.7 | |
| Sensory ProfileDomains in Social–Emotional responses related to sensory processing | |||||||
| Behavioral Outcomes of Sensory Processing | TP = 11 | 65.6 ± 7.3 | 61.8 ± 3.8 | 56.3 ± 5.5 | 38.5 ± 3.6 | 34.8 ± 0.4 | 23.5 ± 1.0 |
| BD = 9 | 60.3 ± 8.2 | 60.8 ± 2.5 | 49.1 ± 7 | 35.4 ± 4.4 | 34.8 ± 0.4 | 22.4 ± 1.4 | |
| AD = 10 | 53.9 ± 7.4 | 57.6 ± 5.5 | 42.9 ± 9.4 | 30.5 ± 5.6 | 34.1 ± 2.1 | 20.9 ± 2.0 | |
| Emotional/Social Responses | TP = 6 | 55.5 ± 13.4 | 57.5 ± 0.7 | 38 ± 17 | 29 ± 9.9 | 34.5 ± 0.7 | 20 ± 4.2 |
| BD = 11 | 68.5 ± 3.3 | 63.8 ± 0.5 | 54 ± 6.8 | 39 ± 1.2 | 35 ± 0 | 22.5 ± 1.9 | |
| AD = 11 | 59.6 ± 8.6 | 59.9 ± 4.5 | 50.5 ± 8.1 | 35.1 ± 5.2 | 34.5 ± 1.3 | 22.6 ± 1.5 | |
| Thresholds for Responses | TP = 19 | 61.1 ± 9.1 | 59.3 ± 4.7 | 52.6 ± 8.8 | 35.4 ± 5.7 | 34.5 ± 1.4 | 22.7 ± 1.9 |
| BD = 7 | 58.6 ± 9.3 | 62 ± 2.6 | 44.3 ± 7.3 | 34.3 ± 5.7 | 34.9 ± 0.4 | 21.7 ± 1.5 | |
| AD = 2 | 62.5 ± 6.4 | 63.5 ± 0.7 | 47 ± 8.5 | 37.5 ± 2.1 | 35 ± 0 | 22.5 ± 0.7 |
Data are means ± standard deviation. Abbreviations: PEDI: Pediatric Evaluation of Disability Inventory; FAsc: Functional Abilities self-care; FAmob: Functional Abilities mobility; FAsf: Functional Abilities social function; CAsc: Caregiver Assistance self-care; CAmob: Caregiver Assistance mobility; CAsf: Caregiver Assistance social function; TP: typical performance; BD: borderline; AD, atypical difference.
Children’s scores on the PEDI for each Sensory Profile domain of sensory profile factor in each of the Sensory Profile categories.
| Sensory ProfileDomains in Sensory Profile Factor | Sensory ProfileCategories (n) | PEDIFAsc | PEDIFAmob | PEDIFAsf | PEDICAsc | PEDICAmob | PEDICAsf |
|---|---|---|---|---|---|---|---|
| Sensory Seeking | TP = 10 | 12.2 ± 10.8 | 60.1 ± 5.6 | 52.2 ± 11.4 | 35 ± 7.7 | 34.3 ± 1.9 | 22.5 ± 2.3 |
| BD = 11 | 61.1 ± 7.2 | 59.6 ± 3.8 | 51.6 ± 5.7 | 36.3 ± 2.5 | |||
| AD = 7 | 57.4 ± 8.3 | 61.6 ± 2.8 | 44.9 ± 8.4 | 34 ± 5.5 | 35 ± 0 | 22 ± 1.7 | |
| Low Endurance/Tones | TP =0 | 0 ± 0 | 0 ± 0 | 0 ± 0 | 0 ± 0 | 0 ± 0 | 0 ± 0 |
| BD = 0 | 0 ± 0 | 0 ± 0 | 0 ± 0 | 0 ± 0 | 0 ± 0 | 0 ± 0 | |
| AD = 28 | 60.5 ± 8.8 | 60.2 ± 4.2 | 50.1 ± 8.9 | 35.2 ± 5.4 | 34.6 ± 1.1 | 22.4 ± 1.7 | |
| Emotional Reactivity | TP =5 | 63.8 ± 6.8 | 57.8 ± 5.9 | 55.8 ± 5.0 | 36.2 ± 4.5 | 33.6 ± 2.6 | 23.2 ± 1.3 |
| BD = 11 | 62.1 ± 9.3 | 60.5 ± 4.7 | 53.1 ± 6.7 | 36.1 ± 5.6 | 34.7 ± 0.5 | 22.7 ± 1.3 | |
| AD = 12 | 57.8 ± 8.9 | 61.1 ± 2.9 | 45.1 ± 9.8 | 34.1 ± 5.9 | 34.9 ± 0.3 | 21.8 ± 2.2 | |
| Inattention/Distractibility | TP = 10 | 61.2 ± 8.6 | 59.8 ± 4.2 | 51 ± 8.4 | 36.6 ± 3.7 | 34.6 ± 0.5 | 22.9 ± 1.2 |
| BD = 2 | 49 ± 7.1 | 50.5 ± 3,5 | 54 ± 1.4 | 26 ± 4.2 | 31.5 ± 3.5 | 22 ± 1.4 | |
| AD = 16 | 61.6 ± 8.5 | 61.8 ± 2.5 | 49.1 ± 9.9 | 35.6 ± 5.6 | 35 ± 0 | 22.2 ± 2.1 | |
| Oral Sensory Sensitivity | TP = 21 | 59.3 ± 9.4 | 59.7 ± 4.6 | 48.7 ± 9.1 | 34.3 ± 5.9 | 34.5 ± 1.3 | 22.0 ± 1.8 |
| BD = 6 | 64.2 ± 6.2 | 71.7 ± 3.0 | 54 ± 8.2 | 37.8 ± 1.7 | 34.8 ± 0.4 | 23.5 ± 1.4 | |
| AD = 1 | 66 ± 0 | 64 ± 0 | 57 ± 0 | 40 ± 0 | 35 ± 0 | 24 ± 0 | |
| Sensory Sensitivity | TP = 6 | 62.7 ± 8.5 | 61.7 ± 3.4 | 49.7 ± 9.0 | 36.8 ± 2.2 | 35 ± 0 | 23.0 ± 1.5 |
| BD = 7 | 62.4 ± 8.9 | 61.3 ± 4.6 | 50.3 ± 8.2 | 36.1 ± 3.7 | 34.7 ± 0.5 | 22.4 ± 1.5 | |
| AD = 15 | 58.9 ± 9.1 | 59.3 ± 4.4 | 50.3 ± 9.8 | 34.2 ± 6.9 | 34.4 ± 1.5 | 22.2 ± 2.0 | |
| Poor Registration | TP = 13 | 61.6 ± 8.4 | 59.5 ± 5 | 53.1 ± 7.1 | 36.2 ± 4.4 | 34.4 ± 1.7 | 22.8 ± 1.5 |
| BD = 10 | 61.9 ± 8.8 | 62.3 ± 2.8 | 49 ± 8.5 | 36.4 ± 4.7 | 34.8 ± 0.4 | 22.6 ± 1.2 | |
| AD = 5 | 55.2 ± 9.7 | 58.2 ± 3.6 | 44.8 ± 12.7 | 30.6 ± 7.8 | 34.8 ± 0.4 | 21.0 ± 2.9 | |
| Fine Motor | TP = 17 | 63.6 ± 8.5 | 62.1 ± 2.5 | 52.2 ± 8.1 | 37.5 ± 4.3 | 34.9 ± 0.3 | 22.8 ± 1.5 |
| BD = 1 | 54 ± 0 | 48 ± 0 | 53 ± 0 | 29 ± 0 | 29 ± 0 | 21.0 ± 0 | |
| AD = 10 | 56 ± 7.7 | 58.4 ± 4.1 | 46.4 ± 10 | 32 ± 5.5 | 34.7 ± 0.5 | 21.9 ± 2.2 | |
| Sedentary | TP =10 | 60.2 ± 9.2 | 58.1 ± 5.8 | 52.7 ± 4.2 | 34.6 ± 5.3 | 34 ± 1.8 | 22.5 ± 1.3 |
| BD = 14 | 60.5 ± 9 | 61.8 ± 3.9 | 49.5 ± 9.3 | 37.3 ± 2.8 | 35 ± 0 | 23 ± 1.8 | |
| AD = 14 | 60.9 ± 9.1 | 61.4 ± 2.4 | 48.5 ± 11.2 | 35.1 ± 6.2 | 34.9 ± 0.3 | 22.2 ± 2.2 |
Data are means ± standard deviation. Abbreviations: PEDI: Pediatric Evaluation of Disability Inventory; FAsc: Functional Abilities self-care; FAmob: Functional Abilities mobility; FAsf: Functional Abilities social function; CAsc: Caregiver Assistance self-care; CAmob: Caregiver Assistance mobility; CAsf: Caregiver Assistance social function; TP: typical performance; BD: borderline; AD, atypical difference.
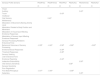
The significant correlation coefficients between variables on the Sensory Profile and PEDI questionnaires are presented in Table 4. Only the significant correlation analyses are included in this Table.
Spearman correlation coefficients (r) (p < 0.05) between the scores on the Sensory Profile domains and the PEDI.
| Sensory Profile domains | PEDIFAsc | PEDIFAmob | PEDIFAsf | PEDICAsc | PEDICAmob | PEDICAsf |
|---|---|---|---|---|---|---|
| (r) | (r) | (r) | (r) | (r) | (r) | |
| Visual | ||||||
| Auditory | 0.43a | |||||
| Touch | −0.43a | |||||
| Vestibular | ||||||
| Oral Sensory | 0.42a | |||||
| Multisensory | ||||||
| Modulation of Movement affecting Activity Level | ||||||
| Modulation Related to Body Position and Movement | ||||||
| Modulation of Visual Input Affecting Emotional Responses | ||||||
| Modulation of Sensory Input Affecting Emotional Responses | ||||||
| Sensory Processing Related to Endurance/Tone | ||||||
| Behavioral Outcomes of Sensory Processing | −0.59b | −0.42a | −0.58b | −0.66b | −0.63b | |
| Emotional/Social Responses | −0.39a | |||||
| Threshold Responses | −0.46a | |||||
| Sensory Seeking | ||||||
| Low Endurance/Tone | ||||||
| Emotional Reactivity | −0.44a | |||||
| Inattention/Distractibility | 0.50b | |||||
| Oral Sensory Sensitivity | 0.38a | |||||
| Sensory Sensitivity | ||||||
| Poor Registration | ||||||
| Fine Motor/Perceptual | −0.51b | −0.46a | −0.58b | |||
| Sedentary | 0.45a |
Abbreviations: PEDI, Pediatric Evaluation of Disability Inventory; FHsc, functional abilities self-care; FHmob, functional abilities mobility; FHsf, functional abilities social function; CAsc, Caregiver assistance self-care; CAmob, caregiver assistance mobility; CAsf, caregiver assistance social function.
The correlation analyses showed that five PEDI domains (FAsc, FAsf, CAsc, CAsf, and CAmob) showed modest significant association with three Sensory Profile (Inattention/Distractibility, Fine Motor/Perceptual, and Behavioral Outcomes of Sensory Processing). The PEDI domain FAmob did not show at least modest significant association with Sensory Profile’s variables, and thus was not included as dependent variables in the regression models. Multivariate linear regression analyses showed the best prediction model for each of the PEDI activity outcomes (CAmob, CAsc, CAsf, FAsc, FAsf), considering for each of these models the three Sensory Profile variables (Inattention/Distractibility, Fine Motor/Perceptual, and Behavioral Outcomes of Sensory Processing) as predictors. Accordingly, in all tested models these three variables were inserted in the base model. With exception of the model involving CAmob (for which none of the predictor variables remained in the final equation model), for all other models the unique variable that remained in the final model was Behavioral Outcomes of Sensory Processing.
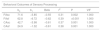
Results of the linear multiple regression showed that the category of Behavioral Outcomes of Sensory Processing tested in Sensory Profile was the only significant predictor of functioning for self-care and social function on the areas of Functional Abilities and Caregiver Assistance (p < 0.05). Therefore, the higher the scores in the Behavioral Outcomes of Sensory Processing (indicating the existence of potential sensory processing disorders), the lower the scores on the PEDI domains of Functional Abilities and Caregiver Assistance, for activities involving self-care and social function Table 5 provides the regression results. The R2 values for each model, indicating the overall explained variance, ranged from 30.5% to 38.9%.
Multivariate linear regression results between parameters of sensory processing and functioning according to the Pediatric Evaluation of Disability Inventory.
| Behavioral Outcomes of Sensory Processing | ||||||
|---|---|---|---|---|---|---|
| b0 | b1 | Beta | r2 | P | VIF | |
| FAsc | 71.6 | −5.85 | −0.55 | 0.31 | 0.002 | 1.000 |
| FAsf | 62.8 | −6.72 | −0.62 | 0.39 | <0.001 | 1.000 |
| CAsc | 42.7 | −3.98 | −0.61 | 0.37 | 0.001 | 1.000 |
| CAsf | 24.9 | −1.32 | −0.61 | 0.38 | 0.001 | 1.000 |
Abbreviations: b0: constant of linear regression equation; b1: coefficient of the predictor variable; FAsc: Functional Abilities self-care; FAsf: Functional Abilities social function; CAsc: Caregiver Assistance self-care; CAsf: Caregiver Assistance social function; VIF = Variance Inflation Factor.
Our results provided some support to our initial hypothesis that sensory processing is associated with activity performance in children with CP levels I and II on the GMFCS. Previous studies tested the role of sensory processing on motor activities,32,33 but they used expensive tools to measure sensory dysfunction in CP, such as cortical activity measurement,33 or they used clinical assessment tools, but in different populations. Kurz et al.33 reported the effects of electrical activity in somatosensory cortex of children with CP on their mobility indices (step length and gait velocity). Their results suggest that motor impairment in these children arises from sensorimotor integration deficits. Cabral et al.32 did not find an association between sensory processing and motor performance in preterm infants. Nevertheless, we have no knowledge of previous studies addressing the influence of sensory processing on activity performance of children with CP that have used clinical measures to establish this association. We highlight the importance of using clinical tools, because they are more accessible to clinicians.
Although we found moderate correlations between the Sensory Profile domain Sedentary and CAmob; and between the Sensory Profile domain Fine motor/Perceptual and FAsc, FAmob and CAsc, the model including these predictor variables of sensory processing presented a weak prediction of activity performance. The only significant predictor variable found for functioning was Behavioral Outcomes of Sensory Processing.
According to our results, the social–emotional responses related to sensory processing, expressed in Behavioral Outcomes of Sensory Processing can be associated with activity performance according to PEDI. The higher the scores in Behavioral Outcomes of Sensory Processing, the lower the scores in PEDI for the domains of Functional Abilities and Caregiver Assistance in areas of self-care and social function. Accordingly, this relationship means that sensory processing disturbances involving the children’s tolerance to unexpected changes, social behavior, and dexterity in activities, may negatively impact activity performance in self-care and social function tasks, increasing the level of dependence from caregiver. We found that 30.5% and 36.7% of variance in self-care activities for Functional Abilities and Caregiver Assistance, respectively, can be explained by variance in scores of Behavioral Outcomes of Sensory Processing. Moreover, 38.9% and 37.6% of variance in social function activities for Functional Abilities and Caregiver Assistance, respectively, can be explained by variance in scores of Behavioral Outcomes of Sensory Processing.
According to the Sensory Profile’s manual25 the topics addressed by the category Behavioral Outcomes in Sensory Processing involve behaviors presented by children in different situations of daily living, such as, whether the child usually talks to himself/herself while performing daily activities, if he/she usually wastes time to perform tasks using inefficient or time-consuming methods, whether they usually show difficulties with writing and manual dexterity, and if they exhibit poor tolerance to unexpected changes in plans or routine. Our results show that atypical behaviors in this sensory area is associated with lower performance and greater level of dependency on activities related to social function as measured on the PEDI, constraining their social interactions and reducing their activity performance.
Although there are other important factors associated with activity performance in CP, such as muscle strength, postural stability, and trunk control,7–9 sensory processing is one of the factors influencing functional abilities and independence on self-care and social-function activities. To study this influence is important, because sensory processing impairments are common in children with CP,10,11,15 and it is not always addressed in clinical settings. Thus, impairments in the central processing of sensory inputs are expected to affect motor function, impacting activities of daily living.
Based on our results, the reduced social abilities in children with CP, such as, learning and abstraction problems, as well as impaired social behaviors, might be determined by the way sensory inputs are centrally processed and integrated.34 Our results also point out the role of sensory processing and modulation in the children’s social interaction with the environment around them.
Atypical sensory processing in Behavior Outcomes was found to be associated with functional abilities and dependence from caregiver in self-care activities. The accomplishment of self-care activities, such as dressing, putting shoes, handling cutlery, and washing and rinsing the body as well as the ability to get around during the various activities performed daily, requires attention focus and motor precision.2,20 Accordingly, difficulties in focus attention, deficits in manual dexterity, and resistance to tolerate unexpected changes in plans or routine, may negatively impact these activities’ performance, increasing dependency and reducing effectiveness.
Therefore, present results point out sensory processing as one of the predictors of activity performance in self-care and social-function areas for children with CP levels I and II of GMFCS. Nevertheless, further studies should explore “for whom” and “in which circumstances” the sensory processing of these children impacts their daily activities. In addition, other capabilities and limitations, as well as, facilitators and barriers that would affect activity should be investigated. Moreover, these results raise the question about the importance of sensory processing assessment in children with CP.
Some limitations might be addressed. Although our sample was composed of children with unilateral and bilateral CP, our small sample size precludes statistical analysis stratifying the participants by the topography of motor dysfunction. Thus, further studies should investigate if the influence of sensory processing on functioning depends on the type of motor impairment of the children. Our small sample size also precluded analyzing the data over a narrower age range.
Another limitation of our study is that the instruments we used are based on parents’ reporting and do not involve direct assessment of the children. Nevertheless, the majority of evidence describing sensory processing disorders stems from parental reports,35 and the main clinical assessment of sensory processing occurs by measures of behavioral responses to sensation,36 which may easily be reported by parents that spend great amount of time with their child.
Finally, data collection for our study occurred in 2013 using the first edition of the Sensory Profile questionnaire, which was updated in 2014. Future studies addressing sensory processing in children should use this latest version, adapted to Brazilian children in 2015.37
ConclusionAtypical behavior in the category of Behavioral Outcomes of Sensory Processing evaluated by Sensory Profile is associated with lower functional abilities and greater dependence from the caregiver in the areas of self-care and social function of PEDI in children with CP levels I-II of GMCS. The results point out the role of sensory processing in the children’s ability to perform daily living activities and in their social interaction with the environment.
Conflict of interestThe authors report no conflict of interest.
This study was supported by grants from the Fundação de Amparo à Pesquisa do Estado de São Paulo - FAPESP, Brazil, (2017/11259-6); FAPESP, Brazil (2013/13380-6). At the time this article was written Silvia L. Pavão was a student at Physical Therapy Department, Federal University of Sao Carlos, SP, Brazil.


