

There is no patient reported outcome measure available in Brazilian Portuguese to comprehensively assess outcomes following administration of patient education programs for people with chronic conditions.
ObjectiveTo describe the cross-cultural adaptation and measurement properties of the Brazilian Portuguese version of the Health Education Impact Questionnaire (heiQ), a multidimensional questionnaire designed for the evaluation of patient education programs, which was tested in people with chronic low back pain (LBP).
MethodsOne hundred thirty-seven individuals with non-specific chronic LBP (age: 38.7 ± 13.2) were enrolled in the study. The translation was performed according to international standards. Intraclass correlation coefficient (ICC) was used to assess test-retest reliability, Cronbach’s α to assess internal consistency, Pearson rank correlation to compare the heiQ scales with comparator scales, and confirmatory factor analysis (CFA) for structural validity.
ResultsThe test-retest analysis yielded ICC values ranging from 0.75 to 0.91. Cronbach’s alphas for the seven scales ranged from 0.70 to 0.89. Significant correlations between affective and general health constructs and the heiQ scales (72%) were observed. For the majority of the scales, the CFA fit statistics showed to be good to excellent.
ConclusionOverall, the Brazilian Portuguese version of the heiQ showed acceptable reliability, internal consistency, construct validity, and structural validity in individuals with chronic LBP. The heiQ scales may serve as direct outcomes to assess education and self-management programs for the Brazilian Portuguese speaker population.
Low back pain (LBP) is ranked in the top three conditions leading to years lived with disability.1 Approximately 33 million people in Brazil have severe chronic spinal pain.2 Most LBP is non-specific which means that for 90% of individuals, the diagnosis of LBP implies no known pathoanatomical cause.3 Psychosocial factors seem to have an important role in chronic LBP and could be associated with poor pain and disability outcomes after treatment.4 Clinical guidelines recommend education and self-management interventions for chronic LBP.5
There is a number of educational approaches for chronic pain, varying in format and content,6 such as Back Schools, self-management programs,7 and pain neuroscience education.8 Despite the recommendation that biopsychosocial programs should be deemed as the first-line treatment in chronic LBP,5 the outcomes assessed in clinical trials involving self-management programs usually assess indirect outcomes like pain decrease or impact of the disease on the patient’s life but fail to encompass direct outcomes such as healthy lifestyle behaviors and knowledge about the disease.9 There is a growing emphasis towards the importance of giving suitable information about the disease and reassurance to patients with chronic conditions.10
A recent systematic review of Patient Reported Outcome Measures suggested the Health Education Impact Questionnaire (heiQ) as an acceptable multidimensional instrument to assess different self-management related constructs.9,11 The heiQ provides a broad profile of the potential impacts of patient education programs,12 covering 8 scales that assess constructs like positive engagement in life and social support.
While the heiQ was developed in English,13 it has been cross culturally adapted and validated into several languages,12,14–19 but there is no version available in Brazilian Portuguese. Therefore, the aim of the present study was to describe the process of cross-cultural adaptation of the heiQ into Brazilian Portuguese and to investigate its measurement properties in individuals with chronic LBP, including test-retest reliability, internal consistency, and construct validity according to the COnsensus-based Standards for the selection of health Measurement Instruments (COSMIN).20–22
MethodsSampleOne-hundred thirty-seven patients between the age of 18 and 60 years old were recruited through medical referrals to a physical therapy outpatient service between March 2017 and June 2018. Eligibility criteria were: medical diagnosis of chronic non-specific LBP, pain in the last three months and/or on at least half of the days in the last six months,24 localized pain between the last thoracic vertebra and gluteal folds, and being fluent in Brazilian Portuguese. Patients that presented with any red flags associated with tumors, inflammatory disorders, infections, and fracture or who had degenerative systemic diseases, neurological symptoms, lumbar stenosis, spondylolisthesis, history of spinal surgeries, or were pregnant were excluded. The study was approved by the Ethics Committee of the Centro Saúde Escola from Ribeirão Preto School of Medicine – Universidade de São Paulo (USP), Ribeirão Preto, SP, Brazil – CAAE 49115715.0.0000.5414. All participants gave written informed consent.
InstrumentsAll the instruments were answered in the self-administered and paper and pencil modes.
The heiQ13 version 3.0 comprises 40 items, covering eight independent scales describing the following constructs:
- 1
Positive and Active Engagement in Life (PAEL- five items);
- 2
Health Directed Activities (HDA - four items);
- 3
Skill and Technique Acquisition (STA - five items);
- 4
Constructive Attitudes and Approaches (CAA - five items);
- 5
Self-Monitoring and Insight (SMI - seven items);
- 6
Health Service Navigation (HSN - five items);
- 7
Social Integration and Support (SIS - five items) and;
- 8
Emotional Distress (ED - six items)
The questionnaire is designed in a structure where items’ responses are scored on a likert-type scale ranging from 1 (strongly disagree) to 4 (strongly agree), with a minimum score of 40 and maximum score of 160. However, it is recommended to use the score of each scale separately. The original heiQ showed acceptable internal consistency and structural validity.13,25 Higher scores on the heiQ represent higher positive impact of health education programs, except for ED scale which is a reversed score scale (higher scores indicate higher emotional distress).
To quantify pain intensity, we used the Numeric Pain Rating Scale (NPRS) which is a simple scale consisting of a sequence of integers, from 0 to 10, where 0 represents "no pain" and 10 represents "worst possible pain."26
As described by COSMIN,22 relationships to scores of other instruments (comparators) could be used to investigate construct validity, considering hypotheses raised a priori. This is further described in the section “hypotheses testing for construct validity.” Accordingly, we considered four comparators addressing constructs (self-efficacy, affective factors, pain and functioning, and general health status), previously described14,16 in the literature, to test for heiQ construct validity.
The Pain Self-Efficacy Questionnaire (PSEQ)27,28 assesses confidence in the personal ability to perform well despite the pain. The PSEQ has 10-items using an ordinal scale from 0 to 6, with a maximum score of 60. A higher score reflects a stronger belief in self-efficacy.
The Hospital Anxiety and Depression Scale (HADS)29,30 is an instrument used to identify anxiety and depression disorders in patients. The tool has two subscales, anxiety (HADS-A) and depression (HADS-D), with seven items in each domain, each item has four response options ranging from 0-3. The score for each subscale ranges from 0 to 21.
The Oswestry Disability Index (ODI)31,32 assesses disability related to chronic LBP. It consists of 10 sections, each presenting 6 answer options, scored from 0 to 5. The final score ranges from 0 to 100, after multiplying the raw score out of 50 by two. The higher scores represent greater disability related to LBP.
The Medical Outcomes Study 36-Item Short-Form Health Survey (SF-36)23,33 is a questionnaire designed to assess global health status perception and consists of 8 scales (physical functioning, physical role limitations, body pain, general health, vitality, social functioning, emotional role, and mental health). Each scale is transformed into a 0–100 scale on the assumption that each question carries equal weight. Lower scores indicate a better health status.
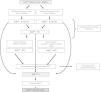
Cross cultural adaptation and translation process and pretestingFirst, we contacted the author of the original publication34 to seek permission for translation and pay for the license to use the questionnaire. Then, we performed the translation and cross-cultural adaptation. While the heiQ is a copyrighted instrument, we followed the procedures of translation as recommended by the developer35 and several recommendations from Beaton et al.36 (Fig. 1). A brief description of the translation procedure is available below Fig. 1.
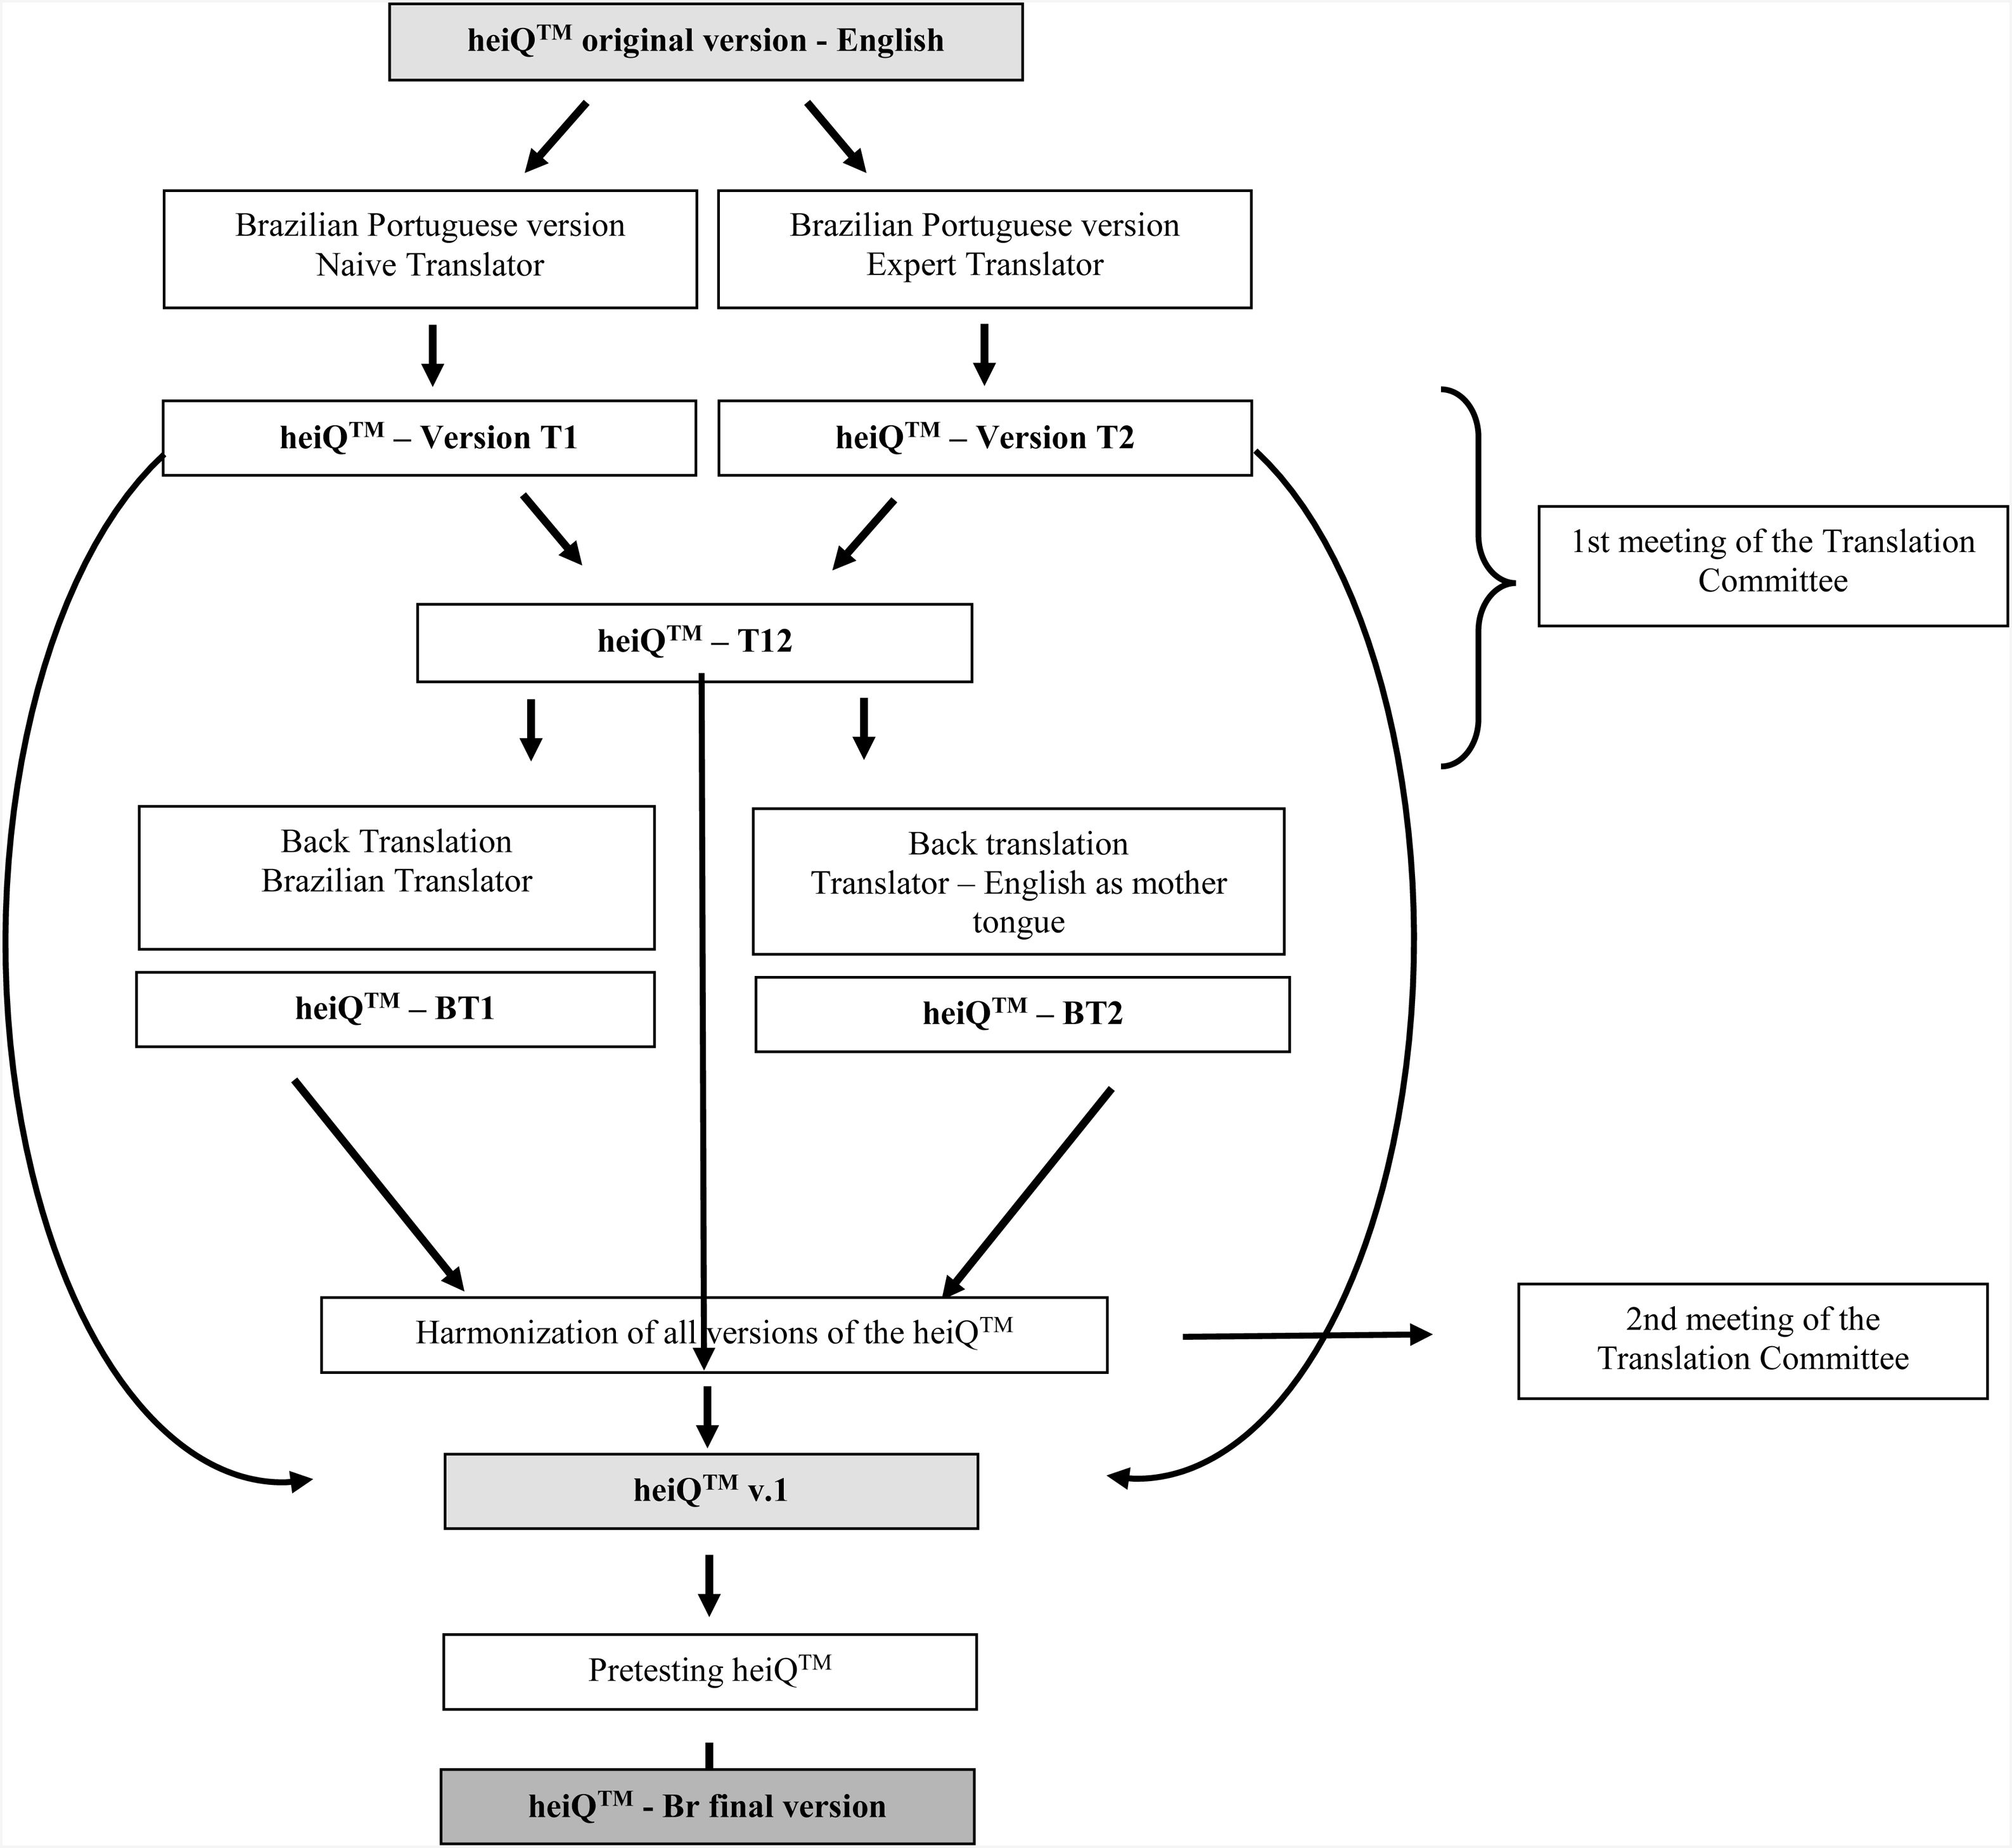
Step 1: Process of cross-cultural adaptation of the heiQ into Brazilian Portuguese. The heiQ was forward translated from English into Brazilian Portuguese by two translators fluent in both languages, with Brazilian Portuguese as their mother language; one was naive, and one was an expert on Rehabilitation for chronic conditions. Step 2: The two Brazilian Portuguese versions were compared and synthesized (T1 + T2 = T12, the synthesis document originated from the two forward translations). Step 3: The Brazilian Portuguese synthesis was then backward translated into English by two new translators (English natives fluent in Portuguese), creating two new backward translation versions: BT1 and BT2. Step 4: Group Cognitive Interview - A committee of translators and researchers (n = 11) comprised of researchers working with chronic conditions, the translators, and the author of the original tool (Prof. Richard Osborne) worked together by videoconference to harmonize all versions of the heiQ. The committee gathered two researchers working with chronic pain conditions, one international researcher with expertise in public health, 3 professional translators (two English native speakers) and four health professionals and PhD students. The meaning of each item in the questionnaire was discussed among committee members and all versions of the questionnaire were compared to validate each item and make corrections when needed. Ultimately the 1st version of the heiQ was submitted to a pre-final testing in which individual cognitive interviews were used to assess the comprehension and meaning of the questionnaire by patients. From this process, emerged the final version of the questionnaire.
T = Forward Translation, BT = Back Translation
The pretesting consisted of administering the prefinal version of the questionnaire to a convenience sample of 30 patients35 of the target audience. Patients with chronic LBP were invited to make suggestions to improve the comprehension of the instrument by individual cognitive interviews covering open-ended questions about: the meaning of the questionnaire items, response options, items' headers, instructions, and layout. Questions were amended if an incomprehensibility index (number of participants with doubts/number of participants enrolled in the study) greater than 20% was reached.
Structural validityStructural validity estimates the extent to which the scores of a measuring instrument are an adequate reflection of the dimensionality of the construct to be measured.37 We adopted Confirmatory Factor Analysis because the most rigorous approach is to attempt to confirm the factor structure previously described.22 The available sample was 137 people with chronic LBP.
Internal consistency, test-retest reliability, and hypotheses testing for construct validityOf the 137 initial respondents, 122 answered the questionnaire a second time after a one-week period to determine test-retest reliability. A one-week period is recommended to avoid recall bias.23
Hypotheses testing for construct validity refers to the extent to which the scores of a patient reported outcome measure are consistent with hypotheses (for instance, the correlation between two instrument scores) based on the assumption that the instrument validly measures the construct to be measured.22 To explore hypotheses testing for construct validity a set of hypotheses (H1 to H6) were raised a priori. We hypothesized:
H1. correlations (r) < 0.65 between the majority of heiQ scales as a confirmation of discriminant validity, as previously reported16;
H2. low to moderate correlations between heiQ and the comparator scales, with the majority of correlations (r) expected to be < 0.6, given that they were intended to measure different constructs14;
H3. low to moderate correlations between pain self-efficacy (PSEQ) and PAEL, CAA, ED, STA, and SIS14;
H4. moderate correlations between psychosocial constructs (anxiety, depression, SF-36 mental health) and the scales PAEL, CAA, and ED14;
H5. moderate correlations particularly between general health constructs (SF-36 vitality, General and Mental Health scales) and the majority of the heiQ scales14;
H6. lower correlations between pain and functioning outcomes (SF-36 physical functioning, role physical and pain, ODI score) versus heiQ scales compared to correlations between affective and general health constructs versus heiQ scales14;
Statistical analysisDescriptive statistics (means and standard deviations) were calculated for the scores on the questionnaire. In addition, for intraclass correlation coefficient (ICC), we reported the 95% confidence interval (CI) and for Root Mean Square Error of Approximation (RMSEA) and Expected Cross-Validation Indexes (ECVI), we described the 90% CI. Univariate and multivariate normality of data distribution were verified using the Shapiro Wilk’s test and Mardia’s normalized estimate of multivariate kurtosis, respectively. Critical ratio of kurtosis <5.0 indicates multivariate normality.38
The floor and ceiling effects were calculated as the percentage of patients whose total heiQ score were between 40 and 50 (minimum scores) and between 150 and 160 (maximal scores), respectively. A 15% cut off was considered in the current study.39
The IBM SPSS AMOS (v. 22) was used to run CFA. As we identified a violation of multivariate normality (critical ratio of kurtosis > 5.0), we ran the analysis using a bootstrap maximum likelihood (ML) method (2000 resamples).40 Bollen–Stine gauges fit without normal theory limitations,41 and p > 0.05 suggests the acceptance of the null hypothesis of global fit. Several indexes of goodness-of-fit were evaluated to confirm the models tested by CFA: (1) consistent Akaike information criterion (CAIC), (2) RMSEA, (3) comparative fit index (CFI), (4) ECVI, (5) Goodness of Fit (GIF), (6) Chi-square (CMIN), and (7) standardized root mean residual (SRMR). RMSEA values below 0.08 indicate an adequate fit.42 For the CFI and GFI, values above 0.90 indicate an adequate fit, and values above 0.95 indicate a good to very good fit. The model with the lowest ECVI value has the best fit.42 The CMIN divided by degrees of freedom (DF) should be less than 3.42 The rule of thumb for SRMR is values less than 0.08. The magnitudes of factor loadings > 0.3 were considered acceptable.
Reliability was calculated using ICC2,1, two-way random effect model and ICC values were classified as poor (<0.40), moderate (0.40−0.75), and excellent (>0.75).43 To provide information regarding the interpretability of the heiQ scores, we also calculated the Standard Error of Measurement (SEM) and the Smallest Detectable Change (SDC).44 The internal consistency was analyzed using Cronbach’s α with acceptable results between 0.70−0.95. 22,23
For construct validity, Spearman’s rho was used, and coefficients above 0.7 were classified as strong, between 0.69 and 0.30 as moderate, and below 0.29 as weak.45
The analyses were performed using the Statistical Package for the Social Sciences (SPSS) for Windows and IBM SPSS (v.22) (IBM, SPSS Inc., Chicago, USA).
ResultsTable 1 presents the descriptive data for each scale of the heiQ and for the remaining patient reported outcome measures. A small number (4%) of data points were missing. We adopted a multiple imputation procedure to handle missing data. Hence, all cases in the original data sets were retained for analysis. We did not observe floor or ceiling effects.
Description of anthropometric, schooling, and clinical/ psychosocial data of patients recruited in this study.
| Variables | Pretesting sample (n = 30) | Reliability sample (n = 122) | Structural validity Sample (n = 137) |
|---|---|---|---|
| Age (years) | 43 ± 12 | 38 ± 12 | 39 ± 13 |
| Weight (kg) | 75.5 ± 13. 8 | 77.5 ± 19 | 77.2 ± 18.6 |
| Height (m) | 1.63 ± 0.1 | 1.67 ± 0.1 | 1.66 ± 0.09 |
| Pain intensity (0−10 NPRS) | 5.88 ± 1.5 | 6.21 ± 1.6 | 6.23 ± 1.6 |
| Years lived with pain | 3.0 ± 2.4 | 9.0 ± 9.0 | 8.0 ± 8.8 |
| Female prevalence (%) | 23 (80%) | 85 (70%) | 98 (71%) |
| Schoolinga | 1 = 17 (57%) | 1 = 19 (15%) | 1 = 24 (17%) |
| 2 = 7 (23%) | 2 = 46 (38%) | 2 = 50 (37%) | |
| 3 = 6 (20%) | 3 = 57 (47%) | 3 = 63 (46%) |
| Patient reported outcomes measures (n = 137) | |
|---|---|
| heiQ-Br Positive and Active Engagement in Life (5−20) | 14.34 ± 3.3 |
| heiQ-Br Health Directed Activity (4−16) | 10.0 ± 3.1 |
| heiQ-Br Skill and Technique Acquisition (4−16) | 10.67 ± 2 |
| heiQ-Br Constructive Attitudes and Approaches (5−20) | 15.57 ± 2.9 |
| heiQ-Br Self-Monitoring and Insight (6−24) | 17.16 ± 3.2 |
| heiQ-Br Health Services Navigational (5−20) | 14.26 ± 2.8 |
| heiQ-Br Social Integration and Support (5−20) | 14.16 ± 3.3 |
| heiQ-Br Emotional Distress (6−24) | 11.24 ± 3.1 |
| SF36 Physical Functioning (0−100) | 65.5 ± 20.3 |
| SF36 Role Physical (0−100) | 51.46 ± 39 |
| SF36 Pain (0−100) | 42 ± 18.4 |
| SF36 General Health (0−100) | 54.38 ± 19.3 |
| SF36 Vitality (0−100) | 47.79 ± 22.9 |
| SF36 Social Functioning (0−100) | 65.21 ± 25.7 |
| SF36 Role emotional (0−100) | 55 ± 39.3 |
| SF36 Mental health (0−100) | 59.73 ± 24.7 |
| PSEQ (0−60) | 46.99 ± 10.7 |
| ODI (0−100) | 19.2 ± 9.5 |
Data are mean ± standard deviation or frequency (proportion).
heiQ-Br = Health Education Impact Questionnaire; SF36 = Medical Outcomes Study 36-item Short-Form Health Survey; PSEQ = Pain Self-Efficacy Questionnaire; ODI = Oswestry Disability Index; NPRS = Numeric Pain Rating Scale; n = sample size.
During the process of translation, several questions needed cultural adaptations and changes were decided by agreement. Afterwards, the pre-final questionnaire obtained was administered to 30 patients with chronic LBP (Table 1) during cognitive interviews and no problematic item was identified.
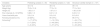
Structural validityThe original heiQ factor structure was previously described as an eight-factor model.11,12 We tested for the eight-factor structure with correlations between factors, however, we obtained poor indexes of model adjustment (CMIN/DF = 1.71, p < 0.01; CFI = 0.74; GFI = 0.68; RMSEA = 0.07). We also tested a model assuming factors were uncorrelated, and the results were also not acceptable (CMIN/DF = 2.25, p < 0.01; CFI = 0.55; GFI = 0.58; RMSEA = 0.09). We therefore checked the structure of each scale separately. For all heiQ scales, acceptable fit indexes were shown (Table 2). For RMSEA, all the scales showed acceptable goodness-of-fit (<0.08) All questions showed acceptable factor loadings (>0.3) (Table 2).
Confirmatory Factor Analysis (CFA) and Internal Consistency results for the scales of the heiQ-Br (n = 137).
| HeiQ scales/items truncated* | Factor Loading | Error Variance |
|---|---|---|
| Positive and Active Engagement in Life | ||
| Q2. On most days I am doing some of the things … | 0.65 | 0.29 |
| Q5. I try to enjoy my life to the fullest | 0.64 | 0.32 |
| Q8. I am doing interesting things in my life | 0.62 | 0.41 |
| Q10.I have plans to do nice things for myself … | 0.60 | 0.24 |
| Q15. I feel that I actively participate in life | 0.69 | 0.31 |
| CMIN/DF = 0.95, p = 0.45, SRMR = 0.02, RMSEA < 0.01 (90% CI = 0, 0.24), CFI = 1.0, GFI = 0.98, ECVI = 0.21 (90% CI = 0.20, 0.25), Cronbach’s α = 0.75 | ||
| Health Directed Activity | ||
| Q1. On most days of the week, I practice at least one activity … | 0.90 | 0.82 |
| Q9. I practice at least one type of physical activity daily for at least 30 min … | 0.57 | 0.63 |
| Q13. On most days of the week I dedicate some time to healthy … | 0.83 | 0.69 |
| Q19. I walk to exercise for at least 15 min a day, most days of the week | 0.61 | 0.46 |
| CMIN/DF = 1.6, p = 0.17, SRMR = 0.08, RMSEA = 0.06 (90% CI = 0, 0.17), CFI = 0.99, GFI = 0.98, ECVI = 0.16 (90% CI = 0.14, 0.23), Cronbach’s α = 0.76 | ||
| Skill and Technique Acquisition | ||
| Q23. I have effective ways to prevent my symptoms … | 0.52 | 0.27 |
| Q25. I have a very good idea of how to manage my health problems | 0.63 | 0.40 |
| Q26. When I have symptoms, I have mean to deal with them | 0.61 | 0.38 |
| Q30.I have a good understanding of equipment/accessories that … | 0.59 | 0.35 |
| CMIN/DF = 1.92, p = 0.15 SRMR = 0.01, RMSEA = 0.07 (90% CI = 0, 0.22), CFI = 0.96, GFI = 0.98, ECVI = 0.16 (90% CI = 0.14, 0.24), Cronbach’s α = 0.79 | ||
| Constructive Attitudes and Approache | ||
| Q27. I try not to let my health problems prevent me … | 0.41 | 0.17 |
| Q34. My health problems do not destroy my life | 0.48 | 0.26 |
| Q36. I feel that I have a very good life… | 0.35 | 0.21 |
| Q39. I do not let my health problems control my life | 0.37 | 0.16 |
| Q40. If others can deal with problems like mine, I can too | 0.40 | 0.40 |
| CMIN/DF = 2.07, p = 0.06, SRMR < 0.01, RMSEA = 0.08 (90% CI = 0.0, 0.18), CFI = 0.97, GFI = 0.96, ECVI = 0.24 (90% CI = 0.21, 0.35), Cronbach’s α = 0.78 | ||
| Self-Monitoring and Insight | ||
| Q3. In addition to going to the doctor, I regularly follow changes … | 0.39 | 0.15 |
| Q6. I know what can start health problems and them | 0.32 | 0.10 |
| Q11. I have a very good understanding of when and why I should take my medicines | 0.63 | 0.40 |
| Q16. When I have health problems, I have a good understanding about what I should … | 0.76 | 0.58 |
| Q17. I follow my health carefully and do what is necessary … | 0.52 | 0.27 |
| Q20. Thinking about my health, I have realistic expectations of what I can and cannot do | 0.49 | 0.24 |
| CMIN/DF = 1.27, p = 0.26, SRMR = 0.03, RMSEA = 0.05 (90% CI = 0, 0.13), CFI = 0.99, GFI = 0.97, ECVI = 0.32 (90% CI = 0.31, 0.41), Cronbach’s α = 0.74 | ||
| Health Services Navigation | ||
| Q24. I have positive relationships with my healthcare professionals | 0.77 | 0.60 |
| Q29. I feel confidently in talking to my doctor what my healthcare needs | 0.79 | 0.62 |
| Q32. I have confidence to give the health professionals the information they need … | 0.60 | 0.36 |
| Q33. I’m able to my needs met from available healthcare resources … | 0.53 | 0.28 |
| Q38. I work in a team with my doctors and other health professionals | 0.40 | 0.16 |
| CMIN/DF = 1.98, p = 0.10 SRMR = 0.03, RMSEA = 0.08 (90% CI = 0.0, 0.20), CFI = 0.997, GFI = 0.97, ECVI = 0.25 (90% CI = 0.22, 0.34), Cronbach’s α = 0.73 | ||
| Social Integration and Support | ||
| Q22. If I need help, I have many people I can count on | 0.75 | 0.58 |
| Q28. I have enough friends to help me face with my health problems | 0.75 | 0.56 |
| Q31. When I am sick, my family and carers really understand … | 0.69 | 0.48 |
| Q35. Overall, I feel well taken care of by my friends or my family | 0.81 | 0.66 |
| Q37. I have enough chances to talk about my health problems … | 0.64 | 0.40 |
| CMIN/DF = 1.8, p = 0.08, SRMR = 0.02, RMSEA = 0.08 (90% CI = 0, 0.17), CFI = 0.97, GFI = 0.97, ECVI = 0.24 (90% CI = 0.21, 0.35), Cronbach’s α = 0.84 | ||
| Emotional Distress | ||
| Q4. I worry about my health often | 0.69 | 0.47 |
| Q7. My health problems make me very dissatisfied … | 0.54 | 0.29 |
| Q12. I often get angry when I think about my health | 0.77 | 0.60 |
| Q14. I feel hopeless because of my … | 0.65 | 0.43 |
| Q18. I get upset when I think about my health | 0.89 | 0.78 |
| Q21. If I think about my health, I get depressed | 0.90 | 0.62 |
| CMIN/DF = 0.33, p = 0.06, SRMR = 0.03, RMSEA = 0 (90% CI = 0, 0.08), CFI = 1, GFI = 0.99, ECVI = 0.28 (90% CI = 0.26, 0.35), Cronbach’s α = 0.69 | ||
CMIN/df = chi-square/degrees of freedom; SRMR = standardized root mean residual; RMSEA = root‐mean‐square error of approximation; 90% CI = 90% confidence interval for RMSEA; CFI = comparative fit index; GFI = goodness of fit; ECVI = expected cross‐validation index; Q = Question.
The Cronbach’s α for all the heiQ scales showed acceptable values and varied from 0.70−0.89, except for ED scale which showed a Cronbach’s α = 0.69 (Table 2). However, the removal of Q4 improved the Cronbach’s α (0.72), which was not observed for the remaining questions.
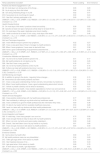
The test-retest reliability showed acceptable ICC values that ranged from 0.75 to 0.91 (Table 3). Table 3 describes the values of SEM and SDC.
Results of test-retest reliability of the heiQ-Br scales (n = 122).
| Scales heiQ (score range) | ICC (95% CI) | SEM | SDCgroup |
|---|---|---|---|
| Positive and Active Engagement in Life (5−20) | 0.86 (0.78, 0.91) | 1.71 | 4.74 |
| Health Directed Activity (4−16) | 0.86 (0.78, 0.91) | 1.50 | 4.16 |
| Skill and Technique Acquisition (4−16) | 0.75 (0.62, 0.85) | 1.02 | 2.84 |
| Constructive Attitudes and Approaches (5−20) | 0.87 (0.78, 0.92) | 1.78 | 4.94 |
| Self-Monitoring and Insight (6−24) | 0.90 (0.84, 0.94) | 1.69 | 4.68 |
| Health Services Navigation (5−20) | 0.85 (0.76, 0.91) | 1.50 | 4.15 |
| Social Integration and Support (5−20) | 0.91 (0.84, 0.94) | 1.63 | 4.52 |
| Emotional Distress (6−24) | 0.80 (0.73, 0.87) | 1.68 | 4.67 |
CI = confidence interval; ICC = intraclass correlation coefficient; SEM (Standard Error of Measurement) = SD√1−ICC.
SDC95group (Smallest Detectable Change) = 1·96 × SEM × √2.
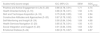
Pairwise comparisons between heiQ scales showed moderate and weak correlations. We confirmed our first hypothesis (H1) as the majority of the correlations were r < 0.65. Our results showed that 81% of overall pairwise correlations were significant. Table 4 describes the correlations between the scores on heiQ scales and with comparator scales. We confirmed low to moderate correlations between heiQ and the comparator scales (r < 0.6) (H2) (Table 4). However, H3 was only partially supported: weak correlations between CAA/ED/SIS with PSEQ (Table 4 – shaded in gray) were observed, but no correlation between PSEQ and STA. We also showed moderate correlations (r>0.3) between anxiety and depression versus PAEL/CAA/ED (Table 4 – shaded in gray) (H4) and moderate correlations between SF-36 vitality, SF-36 General Health, and SF-36 Mental Health and the majority (75%) of the scales from heiQ (H5) (Table 4 – bold).
Correlations between heiQ-Br scales and comparator scales.
| Comparator scales | Positive and Active Engagement in Life | Health Directed Activity | Skill and Technique Acquisition | Constructive Attitudes and Approaches | Self-Monitoring and Insight | Health Services Navigation | Social Integration and Support | Emotional Distressa |
|---|---|---|---|---|---|---|---|---|
| Functioning and Pain Scales | ||||||||
| SF-36 Physical functioning | 0.25** | 0.15 | 0.01 | 0.22* | 0.03 | 0.16 | 0.23** | −0.16 |
| SF-36 Role Physical | 0.22** | 0.05 | −0.05 | 0.27** | −0.06 | 0.11 | 0.18* | −0.15 |
| SF-36 Pain | 0.15 | 0.10 | 0.37** | 0.29** | 0.22* | 0.37** | 0.38** | −0.02 |
| Oswestry Disability Index | −0.31** | −0.16 | −0.06 | −0.27** | 0.03 | −0.03 | −0.30** | 0.13 |
| Significant correlations for 43.75% of pairwise comparisons | ||||||||
| Affective Factors | ||||||||
| HADS- Anxiety | −0.35** | −0.20* | −0.23* | −0.35** | −0.14 | −0.15 | −0.18 | −0.35** |
| HADS- Depression | −0.56** | −0.30* | −0.23* | −0.48** | −0.22* | −0.21* | −0.31** | −0.38** |
| SF-36 Mental health | 0.45** | 0.31** | 0.32** | 0.45** | 0.33** | 0.26** | 0.36** | −0.30** |
| SF-36 Role Emotional | 0.10 | 0.03 | 0.02 | 0.14 | −0.07 | 0.01 | 0.07 | −0.15 |
| Significant correlations for 65.65% of pairwise comparisons | ||||||||
| Cognitive and Social Factors | ||||||||
| PSEQ | 0.35** | 0.23* | 0.18 | 0.35** | 0.13 | 0.25* | 0.25** | −0.30* |
| SF-36 Social Functioning | 0.33** | 0.15 | 0.23* | 0.44** | 0.08 | 0.17* | 0.32** | −0.25** |
| Significant correlations for 75% of pairwise comparisons | ||||||||
| Global Health Status Perception | ||||||||
| SF-36 General Health | 0.30** | 0.31** | 0.23** | 0.34** | 0.25** | 0.36** | 0.35** | −0.33** |
| SF-36 Vitality | 0.55** | 0.40** | 0.30** | 0.48** | 0.22** | 0.22* | 0.42** | −0.28** |
| Significant correlations for 100% of pairwise comparisons | ||||||||
Bold areas highlight the correlations raised a priori and supported by the results (hypothesis confirmation).
And ultimately, our findings supported a lower number of correlations between functioning and pain outcomes versus heiQ scales (43.75%) when compared with correlations between affective and general health constructs versus heiQ scales (76.5%) (H6) (Table 4).
DiscussionThe aim of the current study was to conduct the cross-cultural adaptation of the heiQ into Brazilian Portuguese and investigate the measurement properties of the heiQ in people with chronic LBP. The Brazilian Portuguese version of the heiQ (heiQ-Br) showed acceptable levels of reliability, internal consistency, construct validity, and structural validity. The heiQ-Br is therefore likely to be a useful measure of proximal outcomes of self-management and health education programs.
The heiQ was previously translated into different languages,12,14–19 although this is the first study to test the heiQ in a sample of patients with chronic LBP. The majority of previous studies had included mixed samples, comprised of patients with different chronic conditions like atopic dermatitis, diabetes, and cardiovascular disease.12,14,16
We just enrolled patients with chronic LBP as the aim of this study was to demonstrate measurement properties of the heiQ in this patient population. It is recommended for psychometric purposes that the target sample should be as specific as possible.38 Moreover, a previous study showed lack of measurement invariance i.e.: lack of equivalence of the construct across groups with different conditions,46 for several heiQ scales.47 These results suggest that heiQ is a robust tool for studies within conditions but not across different health conditions.
Overall, few cultural adaptations were necessary during the translation process and participants with chronic LBP did not report difficulty understanding the items during the cognitive interviews, stating that questions were easy to understand.
In the current study, we showed acceptable goodness-of-fit for the heiQ scales when testing the model structure of each scale separately. Our results are not in agreement with previous translations of the heiQ14,16,18 which tested the heiQ as an eight-factor structure and this is likely explained by the small sample considered in the present study to run confirmatory factor analysis (n = 137). However, a previous study also reported a good fit just when the single-factor scales were tested.12
The test-retest reliability for all scales of the heiQ yielded acceptable results. The sample size adopted in our study for test-retest reliability was considered excellent (n = 122) considering COSMIN risk of bias checklist.48 Our results agree with the findings reported for the Japanese version.15 However, French16 and German14 versions showed lower test-retest reliability. One explanation for this difference may be found in the time frame between the administrations of the heiQ, as the short time between test-retest administrations could contribute to better reliability due to low probability of symptoms flare-ups. This time frame has been reported as acceptable.23
Internal consistency of the heiQ scales showed acceptable values for all scales, except for ED scale. Although, note that a Cronbach’s α of 0.69 of ED scale is very close to the minimum acceptable value of 0.70. Additionally, the Norwegian18 and Dutch12 versions showed no suitable values for internal consistency for SMI scale.
The Cronbach’s α, with item deleted, showed that Q4 (I often worry about my health), could explain the low internal consistency of the ED scale. Schuler et al.14 reported that items Q4 and Q8 on the German heiQ version had to be adjusted to improve the fit of the scale. One possible explanation for this finding is that in Brazilian Portuguese, the sentence “to worry about health” could be interpreted with a positive connotation i.e., “take care of yourself”, rather than a negative meaning – a maladaptive excessive worry about health condition. In this way, we suggested an update for Q4 changing the semantic to address the negative connotation (“Minha condição de saúde me deixa preocupado com frequência” rather than “Eu me preocupo com minha saúde com frequência”).
Most of our hypotheses about construct validity (hypothesis testing) were confirmed: correlation coefficients were r<0.6, showing that the heiQ scales capture other constructs than the comparator scales. This finding confirms the discriminant validity of heiQ scale as reported by previous studies.14
Also, our findings supported the mild to moderate correlations between pain self-efficacy versus PAEL/CAA/ED Scale and SIS. Although, our findings did not identify a correlation between pain self-efficacy versus STA as reported in the French version.16 Such result is noteworthy, suggesting that “to be confident” and “have skills to manage symptoms” are distinct domains for patients with chronic LBP.
Furthermore, several heiQ scales (PAEL/CAA/ED) showed moderate correlations (r > 0.3) with anxiety, depression, psychosocial factors, and three of the SF-36 scales (vitality, General Health, and Mental Health) supporting the results described by Schuler et al.14 Such findings may indicate that those scales are measuring mental health constructs. However, surprisingly higher negative correlations between depression versus PAEL/CAA than with ED were observed. Therefore, one can argue that low scores on PAEL/CAA scales could be better predictors of depression than ED scores. Accordingly, a previous study reported depression as one of the barriers to pain self-management.49
We showed a lower number of correlations between pain and functioning outcomes versus heiQ scales compared to correlations between affective and general health constructs versus heiQ scales and thereby we confirmed our hypothesis raised a priori. As long as the heiQ was developed with the aim to assess direct outcomes in self-management programs, we did not expect for greater correlations between heiQ scales (knowledge and beliefs, self-regulation skills, and abilities) versus pain or disability or functioning (indirect outcomes).14
Because the heiQ scale is a multidimensional tool it is recommended to use the scores of each separate scale, because the overall score prevents specific clinical interpretation for decision making. Also, the heiQ should be administered prior to and after interventions focused on health education, as the questionnaire measures direct outcomes. There is a recent paper describing normative values for heiQ scales according to sex, schooling years, country of birth, and age.50 These percentile ranks may help health professionals interpret patient’s responses on the heiQ and also make inferences regarding the impact of educational information in the health status of patients with chronic conditions. In addition, health professionals should pay attention to the SDC of each heiQ scale which ranges from 2.84 to 4.94. Any change in health education impact should be greater than the SDC to be considered relevant. However, future studies are needed to determine the minimal important change (MIC) of heiQ scores using anchor-based responsiveness analysis.
The current study has 2 important limitations. 1) The small sample size for the confirmatory factor analysis. Future work would be strengthened by using more robust statistical approaches including to check for the eight-factor model as previous heiQ studies have done. 2) The specific inclusion of participants with chronic LBP. We recommend that future studies checked for measurement properties of the heiQ in different chronic health conditions.
ConclusionOverall, the Brazilian Portuguese version of the heiQ showed acceptable reliability, internal consistency, construct validity, and structural validity in individuals with chronic LBP. The heiQ scales may serve as direct outcomes to assess education and self-management programs for the Brazilian Portuguese speaker population.
Conflict of interestThe authors declare that they have no competing interests.
We would like to acknowledge the professional translators (Luisa Maria Larcher Caliri, Luana C. Guedes de Oliveira and John Carpenter) for the support and work during the cross-cultural adaptation of the heiQ-Br. We would like to also thank FAEPA (Fundação de Apoio ao Ensino, Pesquisa e Assistência do Hospital das Clínicas da Faculdade de Medicina de Ribeirão Preto da Universidade de São Paulo) for the financial support.


