




Cardiac rehabilitation (CR) is a proven, cost-effective secondary prevention intervention. Latin America and the Caribbean (LAC) bears a disproportionate burden of cardiovascular diseases yet limited CR availability. This Global Audit aimed to characterize CR coverage and delivery (access, staffing, core components, dose) in LAC, comparing findings with ICCPR’s 2016 Audit and current global data.
MethodsBetween May-September 2025, any phase II CR programs in all 35 LAC countries were identified through local Societies and surveyed (REDCap). Ischemic heart disease incidence was extracted from the Global Burden of Disease study 2023 estimates to reflect CR need, and juxtaposed with annual program volume data.
ResultsCR was available in 25 (71.4%) LAC countries, comprising 337 programs–a 32.2% increase from 2016. Responses were received from 255 programs in 19 (76.5%) countries with CR. Based on need, the total estimated service shortfall across the region was 635,945 patients/year, with a median of 2.9% coverage/country. Systematic CR referral was infrequent (6.3%), except in Chile. Fewer patients were paying out-of-pocket, but were paying more where they were. Using purchasing power parity, delivery costs per program were significantly lower in LAC than globally (p<.001). Multidisciplinary teams comprised 5 (median; P25-P75=3.8–7.0) members. Programs delivered 9/10 (P25-P75=7.0–10.0) core components, with patient education nearly universal, but tobacco cessation interventions-while increased from 2016-still lower than globally. Alternative model availability remained relatively unchanged from 2016 at <20%, and lower than that globally (29.5%). Total median dose was 25 sessions per supervised program, and 12/patient in alternative models.
ConclusionsHigh-quality CR persists, but system-level shortfalls limit impact.
Latin America and the Caribbean (LAC) - a region comprising 35 countries of varying economic status - continues to bear a substantial burden of cardiovascular diseases (CVD).1 Recent data encouragingly show reductions in CVD mortality, prevalence, and disability-adjusted life year rates from 1990 to 2019,2 likely reflecting improvements in healthcare infrastructure, public health initiatives, and lifestyle interventions in the region.2,3 However, significant geographic, socioeconomic, and healthcare disparities persist,4 leading to pronounced inequalities in CVD outcomes and access to preventive and treatment services. Continued efforts are needed to ensure equitable progress across all countries and population groups.1
Therefore, there is an ongoing need for secondary prevention, such as cardiac rehabilitation (CR). CR is a well-established comprehensive outpatient model of care delivered by a multidisciplinary team.5 CR participation is associated with significant improvements survival, reduced morbidity and re-hospitalization, as well as meaningfully-enhanced quality of life.6 Despite its well-documented low cost as well as cost-effectiveness,7 CR remains significantly under-available globally,8 including in LAC.9
Indeed, the International Council of Cardiovascular Prevention and Rehabilitation (ICCPR) undertook a first ever Global Audit of CR availability, and where available, audit of the nature of services delivered, a decade ago.10,11 Results showed that CR was available in 24 (68.6%) of LAC countries, with only a median of 3 programs/country. When considering annual ischemic heart disease (IHD) burden estimates from the Global Burden of Disease study, results revealed only one CR “spot” per 24 incident patients.9 Where available, in two-thirds of programs, patients were paying out-of-pocket for services (versus on one-third globally), CR teams had smaller and less multidisciplinary teams, and likely relatedly, delivered a less comprehensive suite of recommended components, all significantly differing from global practices. While the dose of CR offered where available was more robust in this region, alternative CR models were significantly less likely to be offered.
The COVID-19 pandemic struck the world in 2020. It had a particularly severe impact in Latin America,12 where social disparities and structural vulnerabilities amplified both health and economic crises. ICCPR’s rapid COVID-19 CR Audit revealed most CR programs were disrupted or temporarily suspended, with uneven reimbursement of home-based models.13 Given these changes, it is crucial to re-assess the landscape of CR post-pandemic, particularly in LAC.
Therefore, the first aim of this study was to characterize CR availability, volume, service shortfall and coverage in LAC. The secondary aims were to characterize the available delivery of CR in LAC countries with regard to: (a) program access (including funding considerations) and referral practices, (b) composition and number of healthcare professionals on CR teams, (c), core components delivered, including (d) risk factors assessed in the initial assessment, and (e) CR dose by model. Thirdly, the nature of CR in these domains in LAC is compared to the rest of globe, and the nature of CR in LAC in this 2025 Audit Update are compared to the initial Audit a decade ago.
MethodsDesign and procedureThis sub-analysis of ICCPR’s 2025 Global CR Audit Update was cross-sectional and observational in design. The study protocol was approved by the ICCPR Executive and publicly posted prior to study initiation (https://globalcardiacrehab.com/2025/26-Audit-Update). Ethics approval was obtained from the York University Research Ethics Board (Toronto, Canada; e2025–057). This study was conducted in accordance with the ethical principles of the Declaration of Helsinki of the World Medical Association. Global findings related to CR coverage,14 access and referrals,15 core components offered,16 as well as dose, indications and staffing17 are reported elsewhere.
Detailed methods for the global Audit are reported elsewhere.16 In brief, the World Health Organization’s (WHO) country list served as the basis for this Audit. All countries listed as LAC as per World Bank (WB) regional groupings were the focus for this paper, to enable comparison with the initial Audit LAC results, and considering that the context in the United States and Canada is much different and more well-known than that in LAC.18 Countries were also income classified based on the WB (note there is no classification for Venezuela).18
For each country, national cardiovascular societies or identified local CR leaders were contacted to: (a) confirm the presence of any CR programs, and (b) provide contact information for each program identified.
From May 1st to September 1st, 2025, leads of identified programs were invited via email to provide electronic informed consent and complete the confidential online survey. REDCap was used for survey administration (SurveyMonkey in China). Up to two reminder emails were issued at two-week intervals to non-responders.
ParticipantsThe study population comprised all Phase 2 CR programs identified worldwide. The inclusion criterion was programs offering post-discharge services delivering at least: (1) an initial patient assessment; (2) structured aerobic exercise training, whether supervised or unsupervised (± technology); and (3) at least one additional core component aimed at controlling cardiovascular risk factors (e.g., patient education, psychosocial or dietary counselling, tobacco cessation intervention).5 Programs operating solely for research purposes were excluded.
For the purposes of this study, data from the 35 WB LAC countries were considered.18 Aruba and Bermuda were accordingly considered as individual countries. Note that the British territories were not considered separately (e.g., Cayman Islands). Puerto Rico and the United States Virgin Islands were grouped with the United States, and therefore were only considered in the Global estimates for the purposes of this sub-study (Table 1).
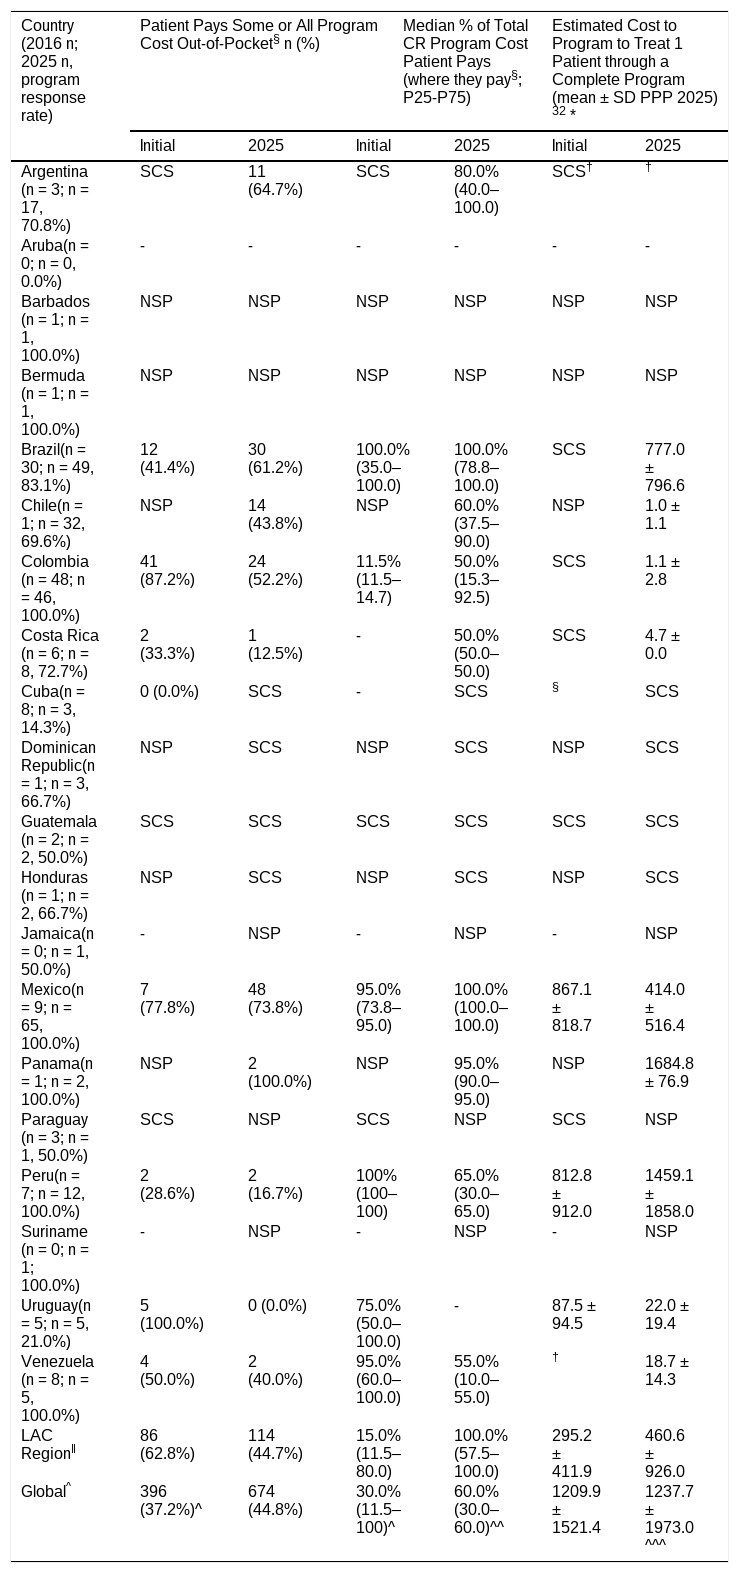
Patient phase II cardiac rehabilitation payment out-of-pocket and cost to serve each patient by Latin American and Caribbean Country with any cardiac rehabilitation and by audit decade.9.
| Country (2016 n; 2025 n, program response rate) | Patient Pays Some or All Program Cost Out-of-Pocket§ n (%) | Median % of Total CR Program Cost Patient Pays (where they pay§; P25-P75) | Estimated Cost to Program to Treat 1 Patient through a Complete Program (mean ± SD PPP 2025)32 * | ||||
|---|---|---|---|---|---|---|---|
| Initial | 2025 | Initial | 2025 | Initial | 2025 | ||
| Argentina(n = 3; n = 17, 70.8%) | SCS | 11 (64.7%) | SCS | 80.0% (40.0–100.0) | SCS† | † | |
| Aruba(n = 0; n = 0, 0.0%) | - | - | - | - | - | - | |
| Barbados(n = 1; n = 1, 100.0%) | NSP | NSP | NSP | NSP | NSP | NSP | |
| Bermuda(n = 1; n = 1, 100.0%) | NSP | NSP | NSP | NSP | NSP | NSP | |
| Brazil(n = 30; n = 49, 83.1%) | 12 (41.4%) | 30 (61.2%) | 100.0% (35.0–100.0) | 100.0% (78.8–100.0) | SCS | 777.0 ± 796.6 | |
| Chile(n = 1; n = 32, 69.6%) | NSP | 14 (43.8%) | NSP | 60.0% (37.5–90.0) | NSP | 1.0 ± 1.1 | |
| Colombia(n = 48; n = 46, 100.0%) | 41 (87.2%) | 24 (52.2%) | 11.5% (11.5–14.7) | 50.0% (15.3–92.5) | SCS | 1.1 ± 2.8 | |
| Costa Rica(n = 6; n = 8, 72.7%) | 2 (33.3%) | 1 (12.5%) | - | 50.0% (50.0–50.0) | SCS | 4.7 ± 0.0 | |
| Cuba(n = 8; n = 3, 14.3%) | 0 (0.0%) | SCS | - | SCS | § | SCS | |
| Dominican Republic(n = 1; n = 3, 66.7%) | NSP | SCS | NSP | SCS | NSP | SCS | |
| Guatemala(n = 2; n = 2, 50.0%) | SCS | SCS | SCS | SCS | SCS | SCS | |
| Honduras(n = 1; n = 2, 66.7%) | NSP | SCS | NSP | SCS | NSP | SCS | |
| Jamaica(n = 0; n = 1, 50.0%) | - | NSP | - | NSP | - | NSP | |
| Mexico(n = 9; n = 65, 100.0%) | 7 (77.8%) | 48 (73.8%) | 95.0% (73.8–95.0) | 100.0% (100.0–100.0) | 867.1 ± 818.7 | 414.0 ± 516.4 | |
| Panama(n = 1; n = 2, 100.0%) | NSP | 2 (100.0%) | NSP | 95.0% (90.0–95.0) | NSP | 1684.8 ± 76.9 | |
| Paraguay(n = 3; n = 1, 50.0%) | SCS | NSP | SCS | NSP | SCS | NSP | |
| Peru(n = 7; n = 12, 100.0%) | 2 (28.6%) | 2 (16.7%) | 100% (100–100) | 65.0% (30.0–65.0) | 812.8 ± 912.0 | 1459.1 ± 1858.0 | |
| Suriname(n = 0; n = 1; 100.0%) | - | NSP | - | NSP | - | NSP | |
| Uruguay(n = 5; n = 5, 21.0%) | 5 (100.0%) | 0 (0.0%) | 75.0% (50.0–100.0) | - | 87.5 ± 94.5 | 22.0 ± 19.4 | |
| Venezuela(n = 8; n = 5, 100.0%) | 4 (50.0%) | 2 (40.0%) | 95.0% (60.0–100.0) | 55.0% (10.0–55.0) | † | 18.7 ± 14.3 | |
| LAC Regionǁ | 86 (62.8%) | 114 (44.7%) | 15.0% (11.5–80.0) | 100.0% (57.5–100.0) | 295.2 ± 411.9 | 460.6 ± 926.0 | |
| Global^ | 396 (37.2%)^ | 674 (44.8%) | 30.0% (11.5–100)^ | 60.0% (30.0–60.0)^^ | 1209.9 ± 1521.4 | 1237.7 ± 1973.0^^^ | |
SD, standard deviation; LAC, Latin America and the Caribbean; PPP, purchasing power parity; CR, cardiac rehabilitation.
- no programs, or no data available.
NSP: data Not Shown to protect program Privacy (i.e., only 1 program in country).
SCS: data not shown due to small cell sizes (SCS) rendering estimates unreliable (≤3 programs responding).
CR need (number of CR-indicated patients/year) was computed using Global Burden of Disease Study 2023 estimates,19 as described in the Supplemental Methods. Operationalization of CR availability (≥1 program; yes/no), volume (number of patients served per year), service levels (shortfall(-)/surplus(+) patients/year), and coverage (%) are described in full there as well.
The survey instrument was adapted from the 2016 Global CR Audit,10,11 with updates invited from the global CR community, as described elsewhere.16 Items relevant to this sub-study assessed: service volumes, referral and access (including funding practices), multidisciplinary team composition, delivery of core CR components, and CR dose. Skip logic was applied to minimize respondent burden (therefore valid percentages are reported throughout). For instance, most questions pertained to supervised models, with a specific subsection on hybrid models and alternative settings. Hybrid CR was defined as offering patients both supervised on-site, and remote or unsupervised sessions (with latter being alternative model/setting).23,24
Programs were asked to specify whether the phase II CR service was located within a hospital and, if so, whether an inpatient cardiology ward was present. For hospital-based programs, respondents further indicated the nature of any referral systems linking inpatient and outpatient CR. Information on program funding sources were queried; for sites where patients paid, program respondents estimated the average proportion of program cost covered by patients.
Respondents were also asked to estimate the total cost to deliver one complete supervised program per patient. To enable valid comparison of program delivery costs across countries and time, all cost estimates were standardized following international health-economic methods20; full details are provided in the Supplemental Methods.
Multidisciplinary team composition was assessed through a list of relevant disciplines, considering also part-time staff. Total program staff size was computed by summing 1.0 full-time equivalent (FTE) for each full-time and 0.5 FTE for each part-time staff member.
Delivery of core CR components was captured using a standardized list aligned with major CR society recommendations.5,21,22 Respondents also indicated which cardiovascular risk factors were assessed at initial evaluation (e.g., blood pressure, lipids, glycemia, physical activity, tobacco use, diet, and psychosocial factors), and about their patient education component.
CR dose was calculated as the product of program duration (weeks) by sessions per week (frequency), for total sessions per patient per program. Dose was reported separately for center-based versus hybrid or alternative delivery settings/models.
Statistical analysisData were analyzed using SPSS version 31.25 All initiated surveys were included in the analysis. Descriptive statistics were computed for all variables, with continuous variables presented as medians with corresponding 25th-75th percentiles (P25-P75), and categorical variables as frequencies and valid percentages.
Data distributions were assessed for normality using the Shapiro-Wilk test. As most continuous variables were not normally distributed, non-parametric tests were applied. Where comparable variables were available, 2025 Audit data were compared with published 2016 Audit results to characterize changes in CR delivery over time.9–11 For continuous variables reported as medians with interquartile ranges, differences between 2016 and 2025 were assessed using the Mann-Whitney U test. For categorical variables, comparisons of proportions were conducted using the chi-square test (or Fisher’s exact test, as applicable). When raw data from the 2016 Audit were not available in the same format, decade comparisons were conducted using available summary statistics with Welch’s t-test applied in MedCalc for variables reported as means with standard deviations.26 In addition, regional estimates were compared with global estimates of program characteristics, patient costs, and service delivery patterns using the same inferential approach, as applicable. Statistical significance was set at p < 0.05.
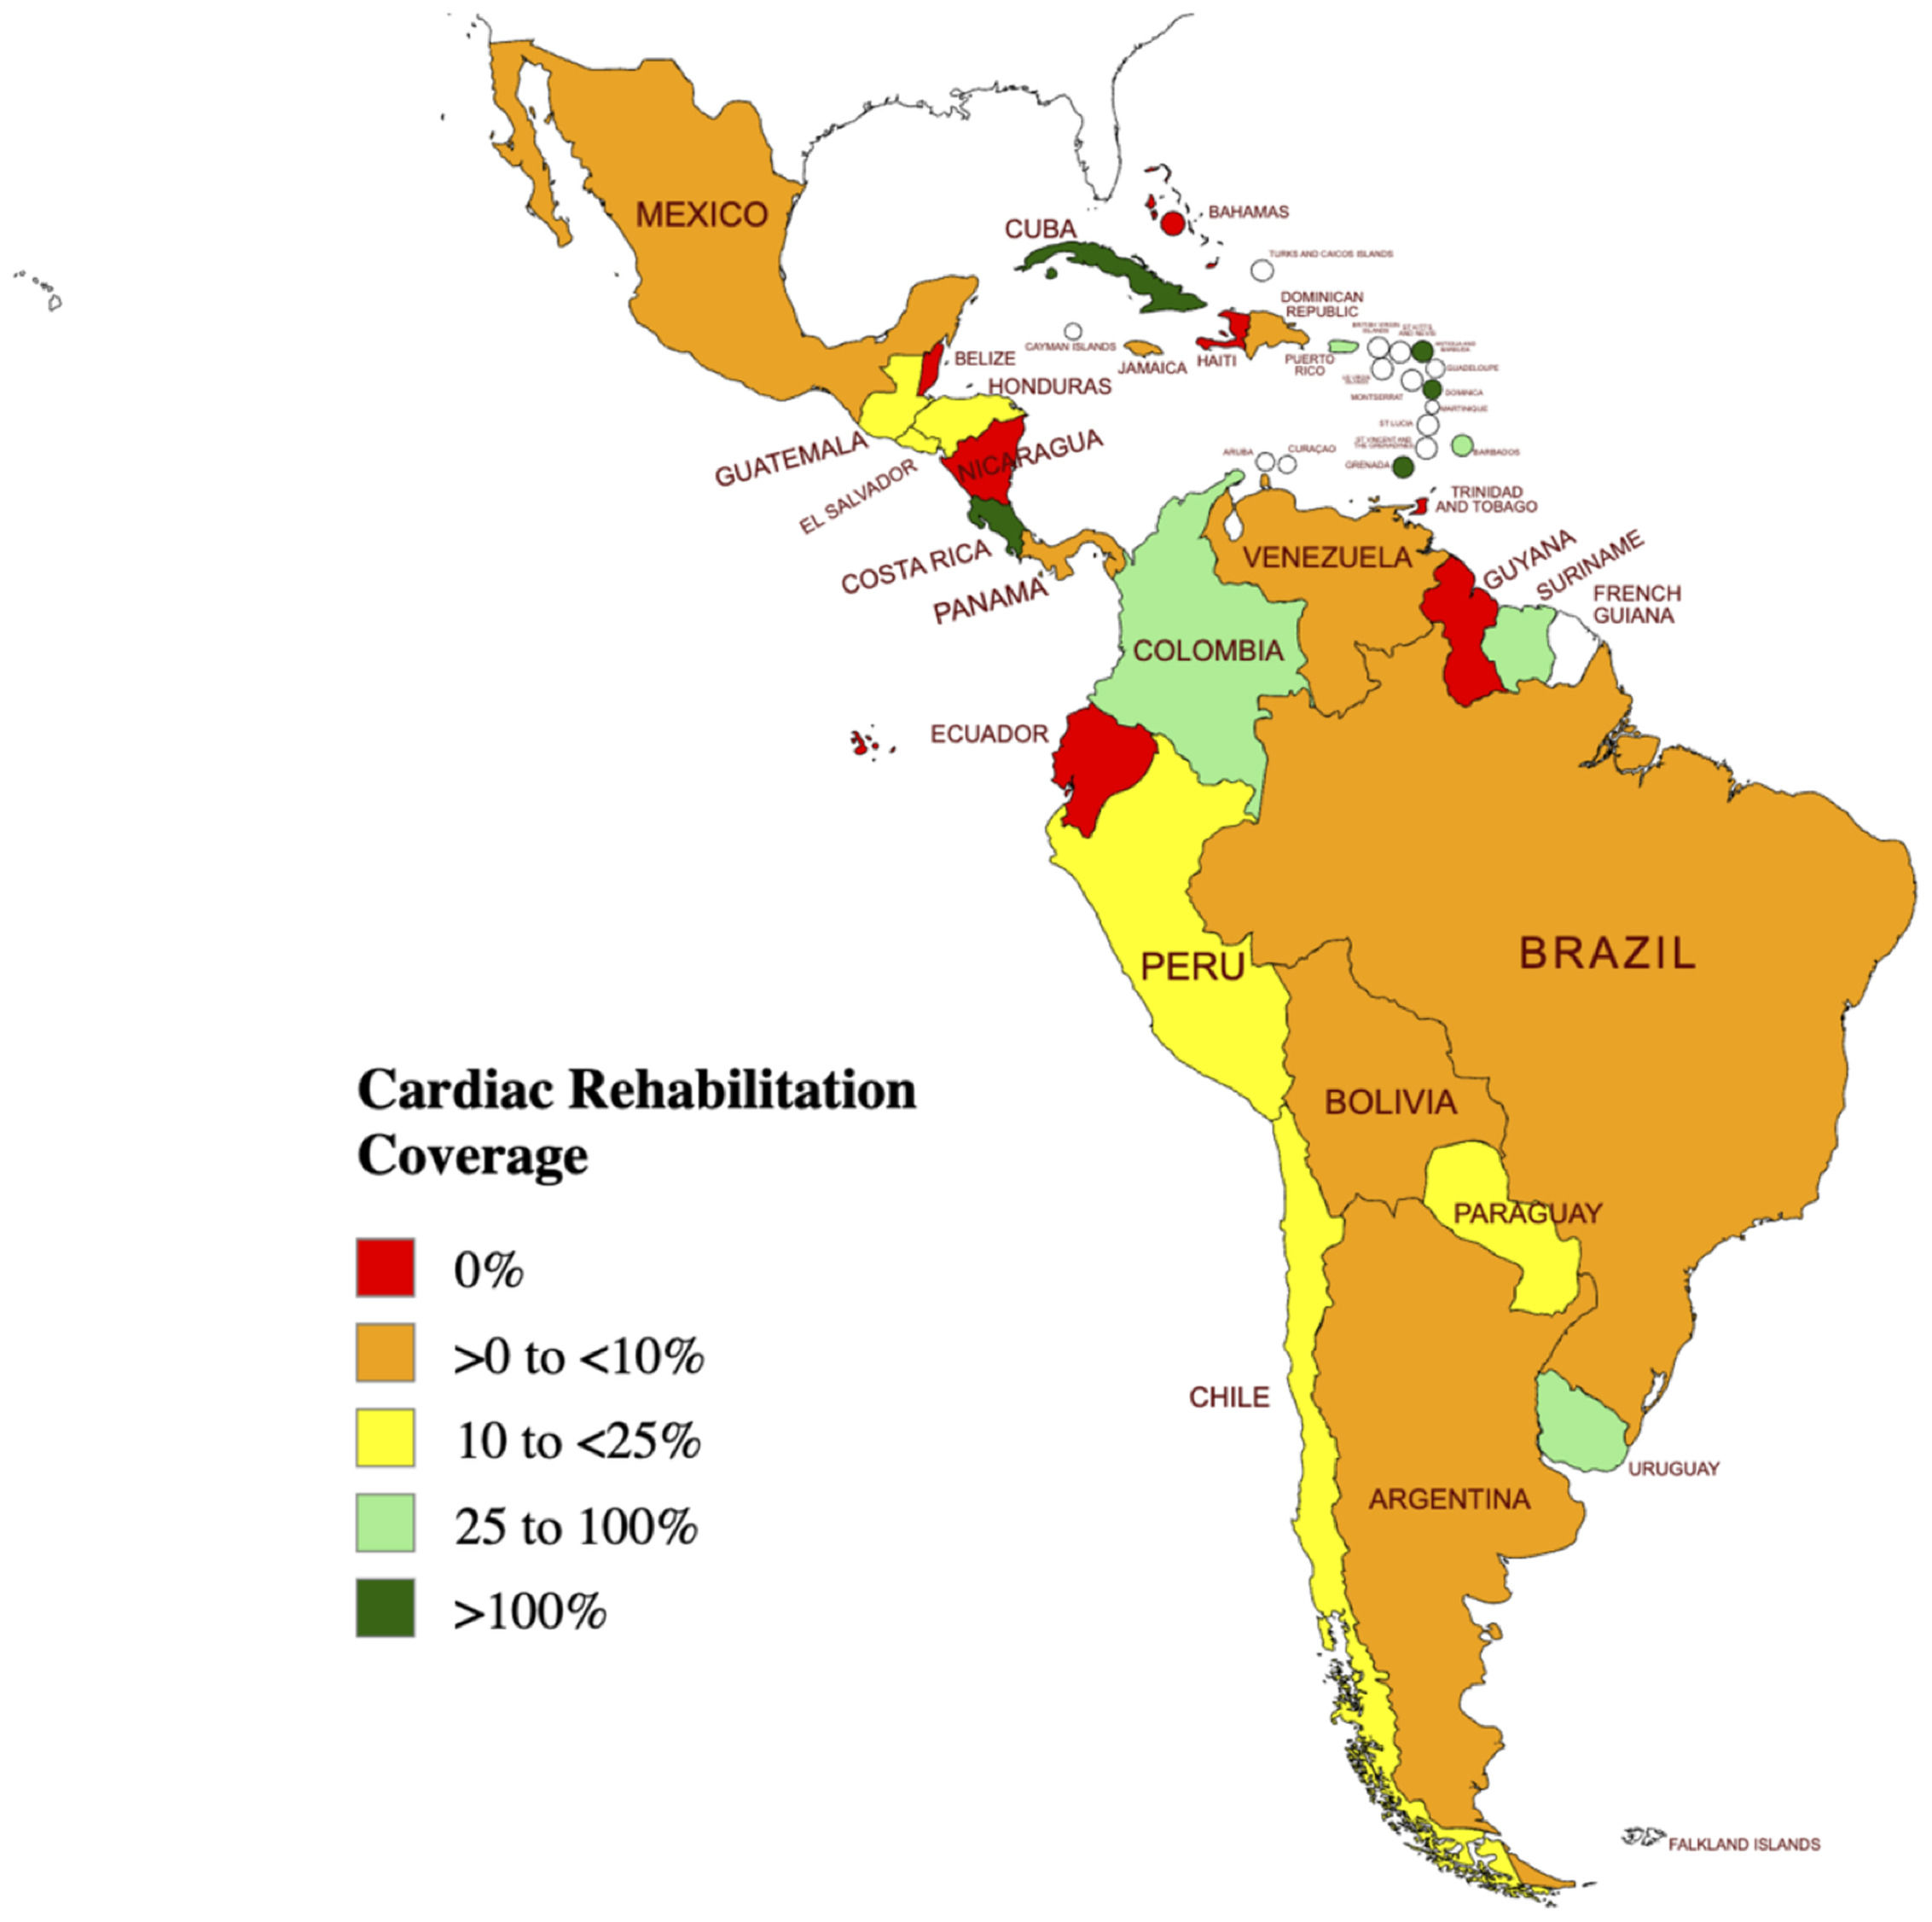
ResultsAudit cohortAs detailed elsewhere,14 113/199 (56.8%) countries in the world were confirmed to have CR available; in LAC countries specifically 25/35 (71.4%) had any phase II CR (Fig. 1). With regard to responses received, globally, at least one survey was initiated by a program from 90/113 (79.6%) of these countries with CR available. In LAC countries, ≥1 surveys were received from programs in 19/25 (76.0%) with available CR (Table 1, left-most column).

In total, 6905 CR programs were confirmed globally. Overall, 1505 (21.4%) programs initiated a survey, with a median program response rate across countries of 62.3% (P25-P75: 24.1–100.0%).14 In LAC, 337 programs were confirmed, of which 255 (75.7%) programs responded (shown by country in Table 1); percentage of responses received per LAC country ranged from 14.3–100.0% of programs, with a median program response rate of 83.1% across countries in the region.
The proportion of LAC countries represented in this ICCPR Audit were similar to that in the first,9,10 where CR was identified in 68.6% of LAC countries, and data were similarly obtained from 20 (57.1%) countries. The number of program responses was higher in the current Audit (255 vs. 139, respectively; see Table 1 for response by country for both Audits). In 2025, all responding CR programs in the 19 LAC countries were located in urban areas (n = 189, 100.0%; 92.8% in 20169). The majority of responding CR programs were situated in a hospital (n = 105, 59.0%), though this proportion declined from 68.1% in 2016,9 suggesting increasing diversification of delivery settings such as community or private clinics (38.8% in 2025).
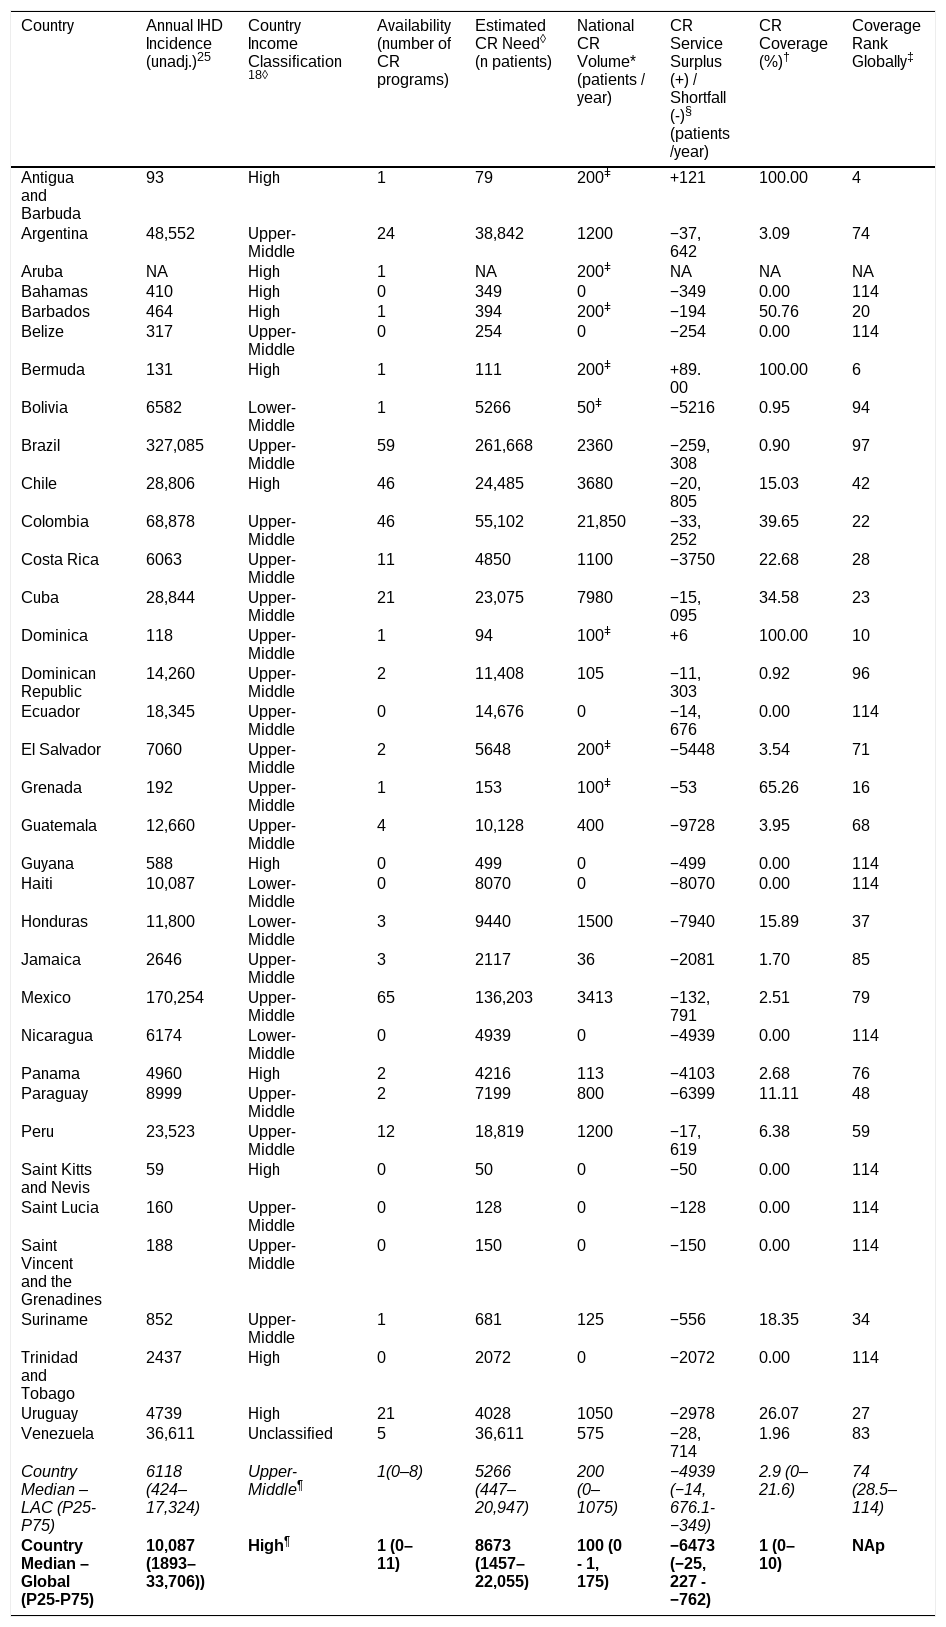
CR availability, program volume, service shortfalls and coverageCR availability is shown in Fig. 1, and number of programs per country in Table 2. The 10 countries without CR available are: Bahamas, Belize, Ecuador, Guyana, Haiti, Nicaragua, Saint Kitts and Nevis, Saint Lucia, Saint Vincent and the Grenadines, Trinidad and Tobago. Since the last Audit,9–11 Ecuador as well as Trinidad and Tobago (n = 2 countries) no longer report any CR availability, while Antigua and Barbuda, Bolivia, Dominica, as well as Suriname (n = 4 countries) newly report programs.
Cardiac rehabilitation availability*, capacity, service shortfall and coverage by LAC country and globally.
| Country | Annual IHD Incidence (unadj.)25 | Country Income Classification18◊ | Availability (number of CR programs) | Estimated CR Need◊ (n patients) | National CR Volume* (patients / year) | CR Service Surplus (+) / Shortfall (-)§ (patients/year) | CR Coverage (%)† | Coverage Rank Globally‡ |
|---|---|---|---|---|---|---|---|---|
| Antigua and Barbuda | 93 | High | 1 | 79 | 200ǂ | +121 | 100.00 | 4 |
| Argentina | 48,552 | Upper-Middle | 24 | 38,842 | 1200 | −37,642 | 3.09 | 74 |
| Aruba | NA | High | 1 | NA | 200ǂ | NA | NA | NA |
| Bahamas | 410 | High | 0 | 349 | 0 | −349 | 0.00 | 114 |
| Barbados | 464 | High | 1 | 394 | 200ǂ | −194 | 50.76 | 20 |
| Belize | 317 | Upper-Middle | 0 | 254 | 0 | −254 | 0.00 | 114 |
| Bermuda | 131 | High | 1 | 111 | 200ǂ | +89.00 | 100.00 | 6 |
| Bolivia | 6582 | Lower-Middle | 1 | 5266 | 50ǂ | −5216 | 0.95 | 94 |
| Brazil | 327,085 | Upper-Middle | 59 | 261,668 | 2360 | −259,308 | 0.90 | 97 |
| Chile | 28,806 | High | 46 | 24,485 | 3680 | −20,805 | 15.03 | 42 |
| Colombia | 68,878 | Upper-Middle | 46 | 55,102 | 21,850 | −33,252 | 39.65 | 22 |
| Costa Rica | 6063 | Upper-Middle | 11 | 4850 | 1100 | −3750 | 22.68 | 28 |
| Cuba | 28,844 | Upper-Middle | 21 | 23,075 | 7980 | −15,095 | 34.58 | 23 |
| Dominica | 118 | Upper-Middle | 1 | 94 | 100ǂ | +6 | 100.00 | 10 |
| Dominican Republic | 14,260 | Upper-Middle | 2 | 11,408 | 105 | −11,303 | 0.92 | 96 |
| Ecuador | 18,345 | Upper-Middle | 0 | 14,676 | 0 | −14,676 | 0.00 | 114 |
| El Salvador | 7060 | Upper-Middle | 2 | 5648 | 200ǂ | −5448 | 3.54 | 71 |
| Grenada | 192 | Upper-Middle | 1 | 153 | 100ǂ | −53 | 65.26 | 16 |
| Guatemala | 12,660 | Upper-Middle | 4 | 10,128 | 400 | −9728 | 3.95 | 68 |
| Guyana | 588 | High | 0 | 499 | 0 | −499 | 0.00 | 114 |
| Haiti | 10,087 | Lower-Middle | 0 | 8070 | 0 | −8070 | 0.00 | 114 |
| Honduras | 11,800 | Lower-Middle | 3 | 9440 | 1500 | −7940 | 15.89 | 37 |
| Jamaica | 2646 | Upper-Middle | 3 | 2117 | 36 | −2081 | 1.70 | 85 |
| Mexico | 170,254 | Upper-Middle | 65 | 136,203 | 3413 | −132,791 | 2.51 | 79 |
| Nicaragua | 6174 | Lower-Middle | 0 | 4939 | 0 | −4939 | 0.00 | 114 |
| Panama | 4960 | High | 2 | 4216 | 113 | −4103 | 2.68 | 76 |
| Paraguay | 8999 | Upper-Middle | 2 | 7199 | 800 | −6399 | 11.11 | 48 |
| Peru | 23,523 | Upper-Middle | 12 | 18,819 | 1200 | −17,619 | 6.38 | 59 |
| Saint Kitts and Nevis | 59 | High | 0 | 50 | 0 | −50 | 0.00 | 114 |
| Saint Lucia | 160 | Upper-Middle | 0 | 128 | 0 | −128 | 0.00 | 114 |
| Saint Vincent and the Grenadines | 188 | Upper-Middle | 0 | 150 | 0 | −150 | 0.00 | 114 |
| Suriname | 852 | Upper-Middle | 1 | 681 | 125 | −556 | 18.35 | 34 |
| Trinidad and Tobago | 2437 | High | 0 | 2072 | 0 | −2072 | 0.00 | 114 |
| Uruguay | 4739 | High | 21 | 4028 | 1050 | −2978 | 26.07 | 27 |
| Venezuela | 36,611 | Unclassified | 5 | 36,611 | 575 | −28,714 | 1.96 | 83 |
| Country Median – LAC (P25-P75) | 6118 (424–17,324) | Upper-Middle¶ | 1(0–8) | 5266 (447–20,947) | 200 (0–1075) | −4939 (−14,676.1- −349) | 2.9 (0–21.6) | 74 (28.5–114) |
| Country Median – Global (P25-P75) | 10,087 (1893–33,706)) | High¶ | 1 (0–11) | 8673 (1457–22,055) | 100 (0 - 1, 175) | −6473 (−25,227 - −762) | 1 (0–10) | NAp |
NA: Not available (response was not provided by any respondent in the country).
Nap: Not applicable.
Income classification was obtained from World Bank.24.
Estimated annual incidence of IHD obtained from Global Burden of Disease study 2023.25.
Acronyms: CR, cardiovascular rehabilitation; IHD, ischemic heart diseases; LAC, Latin America and Caribbean.
Note: due to missing data, percentages are computed where the denominator is the number of valid responses from responding programs.
adjusted IHD incidence: 80% for middle-income countries (upper and lower), and 85% for high-income countries, to take into account early mortality as well as morbidity precluding CR eligibility (see14).
CR Volume: Median number of patients a program reported they served per year (in supervised and/or unsupervised models). This is multiplied by the total number of programs in each country for national volume, in the region for regional, and globally for the global estimate. For countries without a response, national volume was estimated using the country income-class median program volume of supervised programs multiplied by the number of programs verified to exist in that country. Volume is zero in countries with no CR availability.
where data was missing, the country’s income-class median was imputed as described above. Therefore, caution is warranted in interpreting estimates for these countries. Note all countries with an estimated service surplus were computed using the imputed income-class median, as explicated above.
CR Service Surplus/Shortfall: CR volume (national, regional and global) minus need (adjusted number of incident IHD patients per year, per analytic level).
CR Coverage: (volume / need) × 100%, for each analytic level. Values of 100% indicate potential excess capacity (bearing in mind non-ischemic HF and other indicated patient indications could not be considered in CR need).
In the initial Audit9,10 it was estimated there were a total of 255 programs across the LAC region, and 337 in the Audit update. As shown in Table 2, the number of programs per country with available CR in 2025 ranged from 1 in several smaller nations (e.g., Barbados, Bermuda, Honduras, Paraguay) to a maximum of 65 in Mexico, with a median of 1 program/country (P25-P75:0–8). Since the last Global CR Audit,10 there was an increase in the number of programs - notably in Mexico (from 24 to 65 programs), Chile (10 to 46), Cuba (8 to 21), Uruguay (12 to 21), and Costa Rica (6 to 11). Countries with notable reductions in the number of CR programs from 201610 included Brazil (75 to 59 programs), Ecuador (5 to 0), Colombia (50 to 46), Venezuela (9 to 5), as well as Trinidad and Tobago (2 to 0). Program capacity (patients that could be treated/year) is shown in Supplemental Table S1 by Audit decade and LAC country. The median of 198 in the region is greater than that of 160 globally.
Median annual supervised or unsupervised program volume in LAC countries ranged from 0 (i.e., no CR available) to 500 patients annually (median=56.5, P25-P75=0–120). There was a median national volume of 200 patients treated/country/year (P25-P75=0–1075; not comparable globally given lower population in many LAC countries). The total volume was 48,736 patients/year in the region.
As shown in Table 2, there were CR service shortfalls in 31/34 (91.2%; could not be computed for Aruba) LAC countries. Note that in all 3/3 countries that reported a service surplus (i.e., Antigua and Barbuda [n = 121 patients/year], Bermuda [n = 89 patients/year], and Dominica [n = 6 patients/year]; all island nations, where geographic isolation and relatively small populations may also have contribute to the observed service surpluses), the regional median capacity was applied for the service level computation, so caution is warranted in over-interpreting those results.
The greatest CR service shortfall was observed in Brazil (259,308 patients/year), followed by Mexico (132,791) and Argentina (37,642). As also shown in Table 1, the median shortfall per LAC country was −4939 (mean of −18,704). The total estimated service shortfall across the LAC region was −635,945 patients/year, or two-thirds of a million indicated patients who could not be treated due to insufficient services.
With regard to CR service coverage (Table 2), for countries with CR with insufficient service volumes, coverage ranged from 0.9% (Brazil) to 65.3% (Grenada), with a national median of 9.6% CR coverage across the LAC; this is however more favourable than the global median country coverage of 2.9%. By global ranking (Table 2), disregarding countries where the income-class median was imputed due to missing data (e.g., Antigua and Barbuda, Dominica), Barbados (20th best globally), followed by Colombia (22nd), as well as Cuba (23rd) had among the best CR coverage in the region; no other countries ranked under 25th; Other than Colombia, this is potentially partially explained by their island status. Disregarding ranks of 114 reflecting ties for no CR available, Brazil (97th), Dominican Republic (96th), Bolivia (94th), Jamaica (85th), and Venezuela (83rd) had the poorest global rankings.
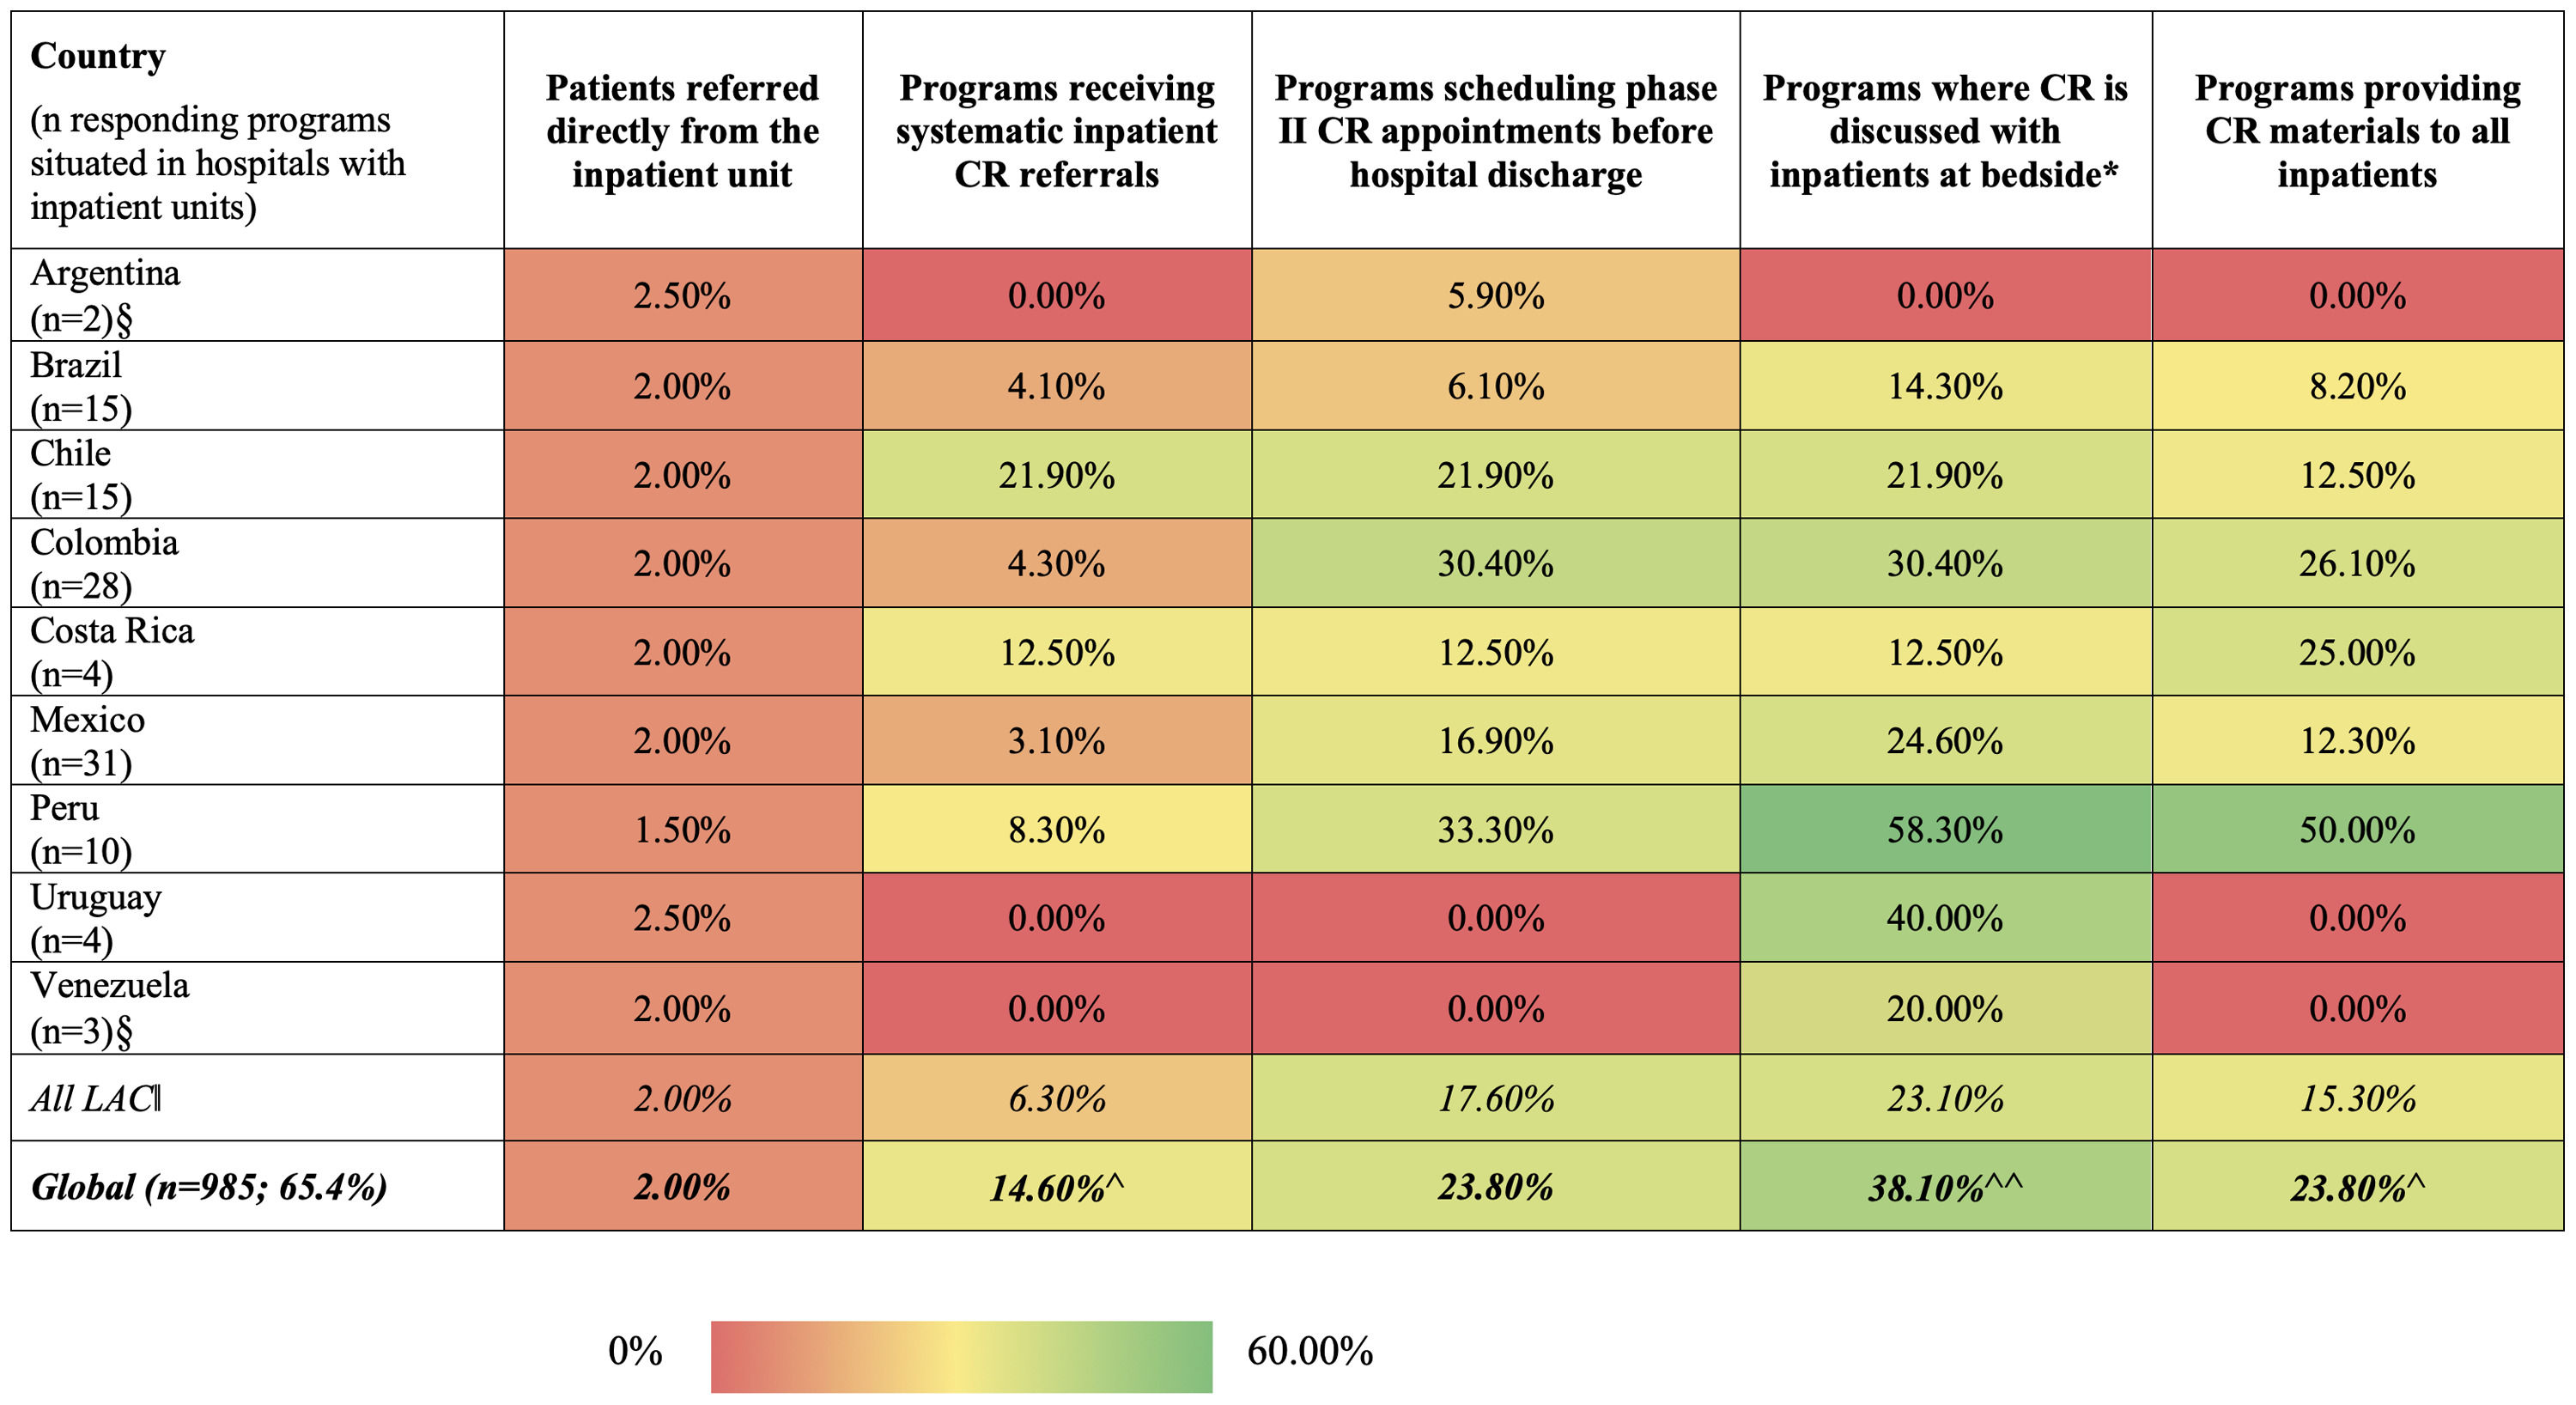
CR access, including referralAmong programs in hospitals, for 119 (83.2%), the hospitals had an inpatient cardiology service (90.3% in 2016).9 Among these programs, they estimated that 49.6 ± 32.6% of inpatients were directly referred to CR prior to discharge (58.2 ± 34.3% globally in 2025). The most common referral strategies were discussion at the bedside (n = 59, 23.1%), followed by scheduling an initial appointment before discharge (n = 45, 17.6%), and providing informative materials to all inpatients (n = 39, 15.3%); systematic inpatient referral was rarely applied (Fig. 2, by country, region and globally). When compared to inpatient CR referral practices globally, LAC programs significantly less commonly applied systematic referral, CR discussion at the bedside, and provision of informational materials to inpatients (Fig. 2).

Phase II cardiac rehabilitation referral practices in programs situated in hospitals with inpatient cardiology services by Latin American and Caribbean Country vs Globally, n = 119.
Note: for each practice, the estimated proportion per year is reported.
ǁCountry-level data in Barbados, Bermuda, Jamaica, Paraguay and Suriname are not shown to protect program privacy (i.e., only 1 program in country); country-level data in Cuba, Dominican Republic, Guatemala, Honduras and Panama not shown due to small cell sizes rendering estimates unreliable (≤3 programs responding). Any values are included in regional row, to optimize generalizability.
*physician, non-physician clinician, peer, or volunteer.
§caution warranted in interpreting results due to small number of responding programs situated in hospitals with inpatient units.
Acronyms: CR, cardiac rehabilitation; LAC, Latin America and the Caribbean.
^LAC vs global: ^p<.05; ^^p<.01; ^^^p<.001.
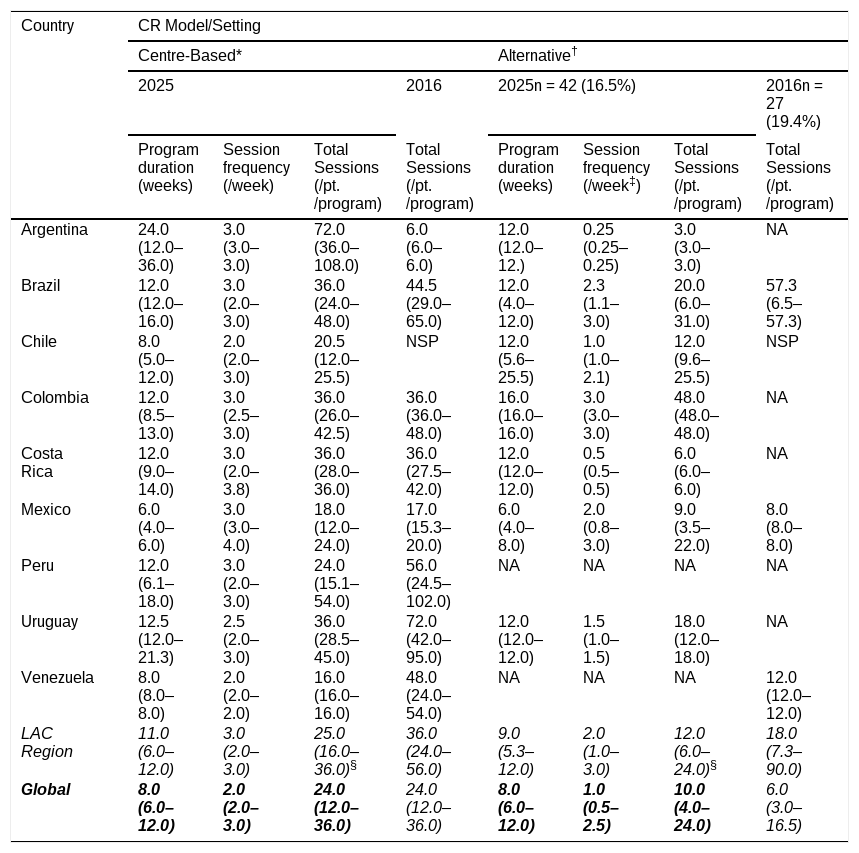
Alternative models, including home-based or hybrid CR, and community-based settings which can be more accessible, were available in 42 (16.5%) programs across the region (Table 3), representing no substantive difference from 27 (19.4%) programs in 2016.9 This is lower than global availability (29.5%).
| Country | CR Model/Setting | |||||||
|---|---|---|---|---|---|---|---|---|
| Centre-Based* | Alternative† | |||||||
| 2025 | 2016 | 2025n = 42 (16.5%) | 2016n = 27 (19.4%) | |||||
| Program duration (weeks) | Session frequency (/week) | Total Sessions (/pt./program) | Total Sessions (/pt./program) | Program duration (weeks) | Session frequency (/week‡) | Total Sessions (/pt./program) | Total Sessions (/pt./program) | |
| Argentina | 24.0 (12.0–36.0) | 3.0 (3.0–3.0) | 72.0 (36.0–108.0) | 6.0 (6.0–6.0) | 12.0 (12.0–12.) | 0.25 (0.25–0.25) | 3.0 (3.0–3.0) | NA |
| Brazil | 12.0 (12.0–16.0) | 3.0 (2.0–3.0) | 36.0 (24.0–48.0) | 44.5 (29.0–65.0) | 12.0 (4.0–12.0) | 2.3 (1.1–3.0) | 20.0 (6.0–31.0) | 57.3 (6.5–57.3) |
| Chile | 8.0 (5.0–12.0) | 2.0 (2.0–3.0) | 20.5 (12.0–25.5) | NSP | 12.0 (5.6–25.5) | 1.0 (1.0–2.1) | 12.0 (9.6–25.5) | NSP |
| Colombia | 12.0 (8.5–13.0) | 3.0 (2.5–3.0) | 36.0 (26.0–42.5) | 36.0 (36.0–48.0) | 16.0 (16.0–16.0) | 3.0 (3.0–3.0) | 48.0 (48.0–48.0) | NA |
| Costa Rica | 12.0 (9.0–14.0) | 3.0 (2.0–3.8) | 36.0 (28.0–36.0) | 36.0 (27.5–42.0) | 12.0 (12.0–12.0) | 0.5 (0.5–0.5) | 6.0 (6.0–6.0) | NA |
| Mexico | 6.0 (4.0–6.0) | 3.0 (3.0–4.0) | 18.0 (12.0–24.0) | 17.0 (15.3–20.0) | 6.0 (4.0–8.0) | 2.0 (0.8–3.0) | 9.0 (3.5–22.0) | 8.0 (8.0–8.0) |
| Peru | 12.0 (6.1–18.0) | 3.0 (2.0–3.0) | 24.0 (15.1–54.0) | 56.0 (24.5–102.0) | NA | NA | NA | NA |
| Uruguay | 12.5 (12.0–21.3) | 2.5 (2.0–3.0) | 36.0 (28.5–45.0) | 72.0 (42.0–95.0) | 12.0 (12.0–12.0) | 1.5 (1.0–1.5) | 18.0 (12.0–18.0) | NA |
| Venezuela | 8.0 (8.0–8.0) | 2.0 (2.0–2.0) | 16.0 (16.0–16.0) | 48.0 (24.0–54.0) | NA | NA | NA | 12.0 (12.0–12.0) |
| LAC Region | 11.0 (6.0–12.0) | 3.0 (2.0–3.0) | 25.0 (16.0–36.0)§ | 36.0 (24.0–56.0) | 9.0 (5.3–12.0) | 2.0 (1.0–3.0) | 12.0 (6.0–24.0)§ | 18.0 (7.3–90.0) |
| Global | 8.0 (6.0–12.0) | 2.0 (2.0–3.0) | 24.0 (12.0–36.0) | 24.0 (12.0–36.0) | 8.0 (6.0–12.0) | 1.0 (0.5–2.5) | 10.0 (4.0–24.0) | 6.0 (3.0–16.5) |
Values reported are median (P25-P75).
NA: not applicable or data not available.
Abbreviations: pt, patient.
Acronyms: CV, cardiovascular; CR, cardiac rehabilitation; LAC, Latin America and the Caribbean.
Funding sources for CR programs in LAC were most commonly patients (i.e., out-of-pocket; n = 141, 55.3%) and/or social security/government (n = 114; 44.7%), with the same sources being most common in 2016.9 In 2025, programs reported a significantly lower proportion of patients had to pay out-of-pocket for CR services compared with 20169(p = 0.04; Table 1, by country and region). Where patients contributed to costs, the median proportion of the total program cost paid increased significantly to 100% in 2025 (p<.001), and this was also significantly higher than the global median (p < 0.01).
Estimated cost to deliver a full program in 2025 purchasing power parity (PPP) dollars are shown in Table 1 by LAC country, region, globally and by Audit decade; the extremely low estimated costs observed in some upper-middle income LAC countries (e.g., Chile, Colombia, Costa Rica) likely reflect a combination of PPP compression effects, public-sector subsidization of CR staff and infrastructure, and respondents reporting marginal or patient-facing fees rather than full economic delivery costs, so these values should be interpreted with caution. Mean program costs per patient per program varied widely, within and across LAC countries. The estimated mean cost for the region was just <500 PPP, significantly lower than the global estimate of over 1200 (p<.001).
Nature of CR deliverySize and types of healthcare professionals on CR teamsPrograms reported a median of five staff members per team, consistent with other countries globally and with LAC team sizes in 20169 (Supplemental Table S1, juxtaposed with program capacity). Of any profession, full or part-time, CR teams most commonly were staffed with physiotherapists (n = 179; 89.5%), similar to 2016.9 Over 70% of programs were staffed with nurses (n = 130), a higher proportion than 2016 (58.7%).9 CR team inclusion of other allied healthcare providers other than other types of exercise professionals was as follows: dietitians (n = 137; 72.1%), psychologists (n = 119; 65.0%), occupational therapists (n = 38; 23.3%), social workers (n = 42; 25.9%), and pharmacists (n = 23; 14.7%; all higher than 2016).9 With regard to specialty of physician leads, this was most often cardiology (n = 176; 84.2%), followed by physiatry (n = 86; 49.1%) and sports medicine (n = 47; 27.5%). Finally, 123 (68.7%) programs had an administrative assistant (73.4% in 2016).9
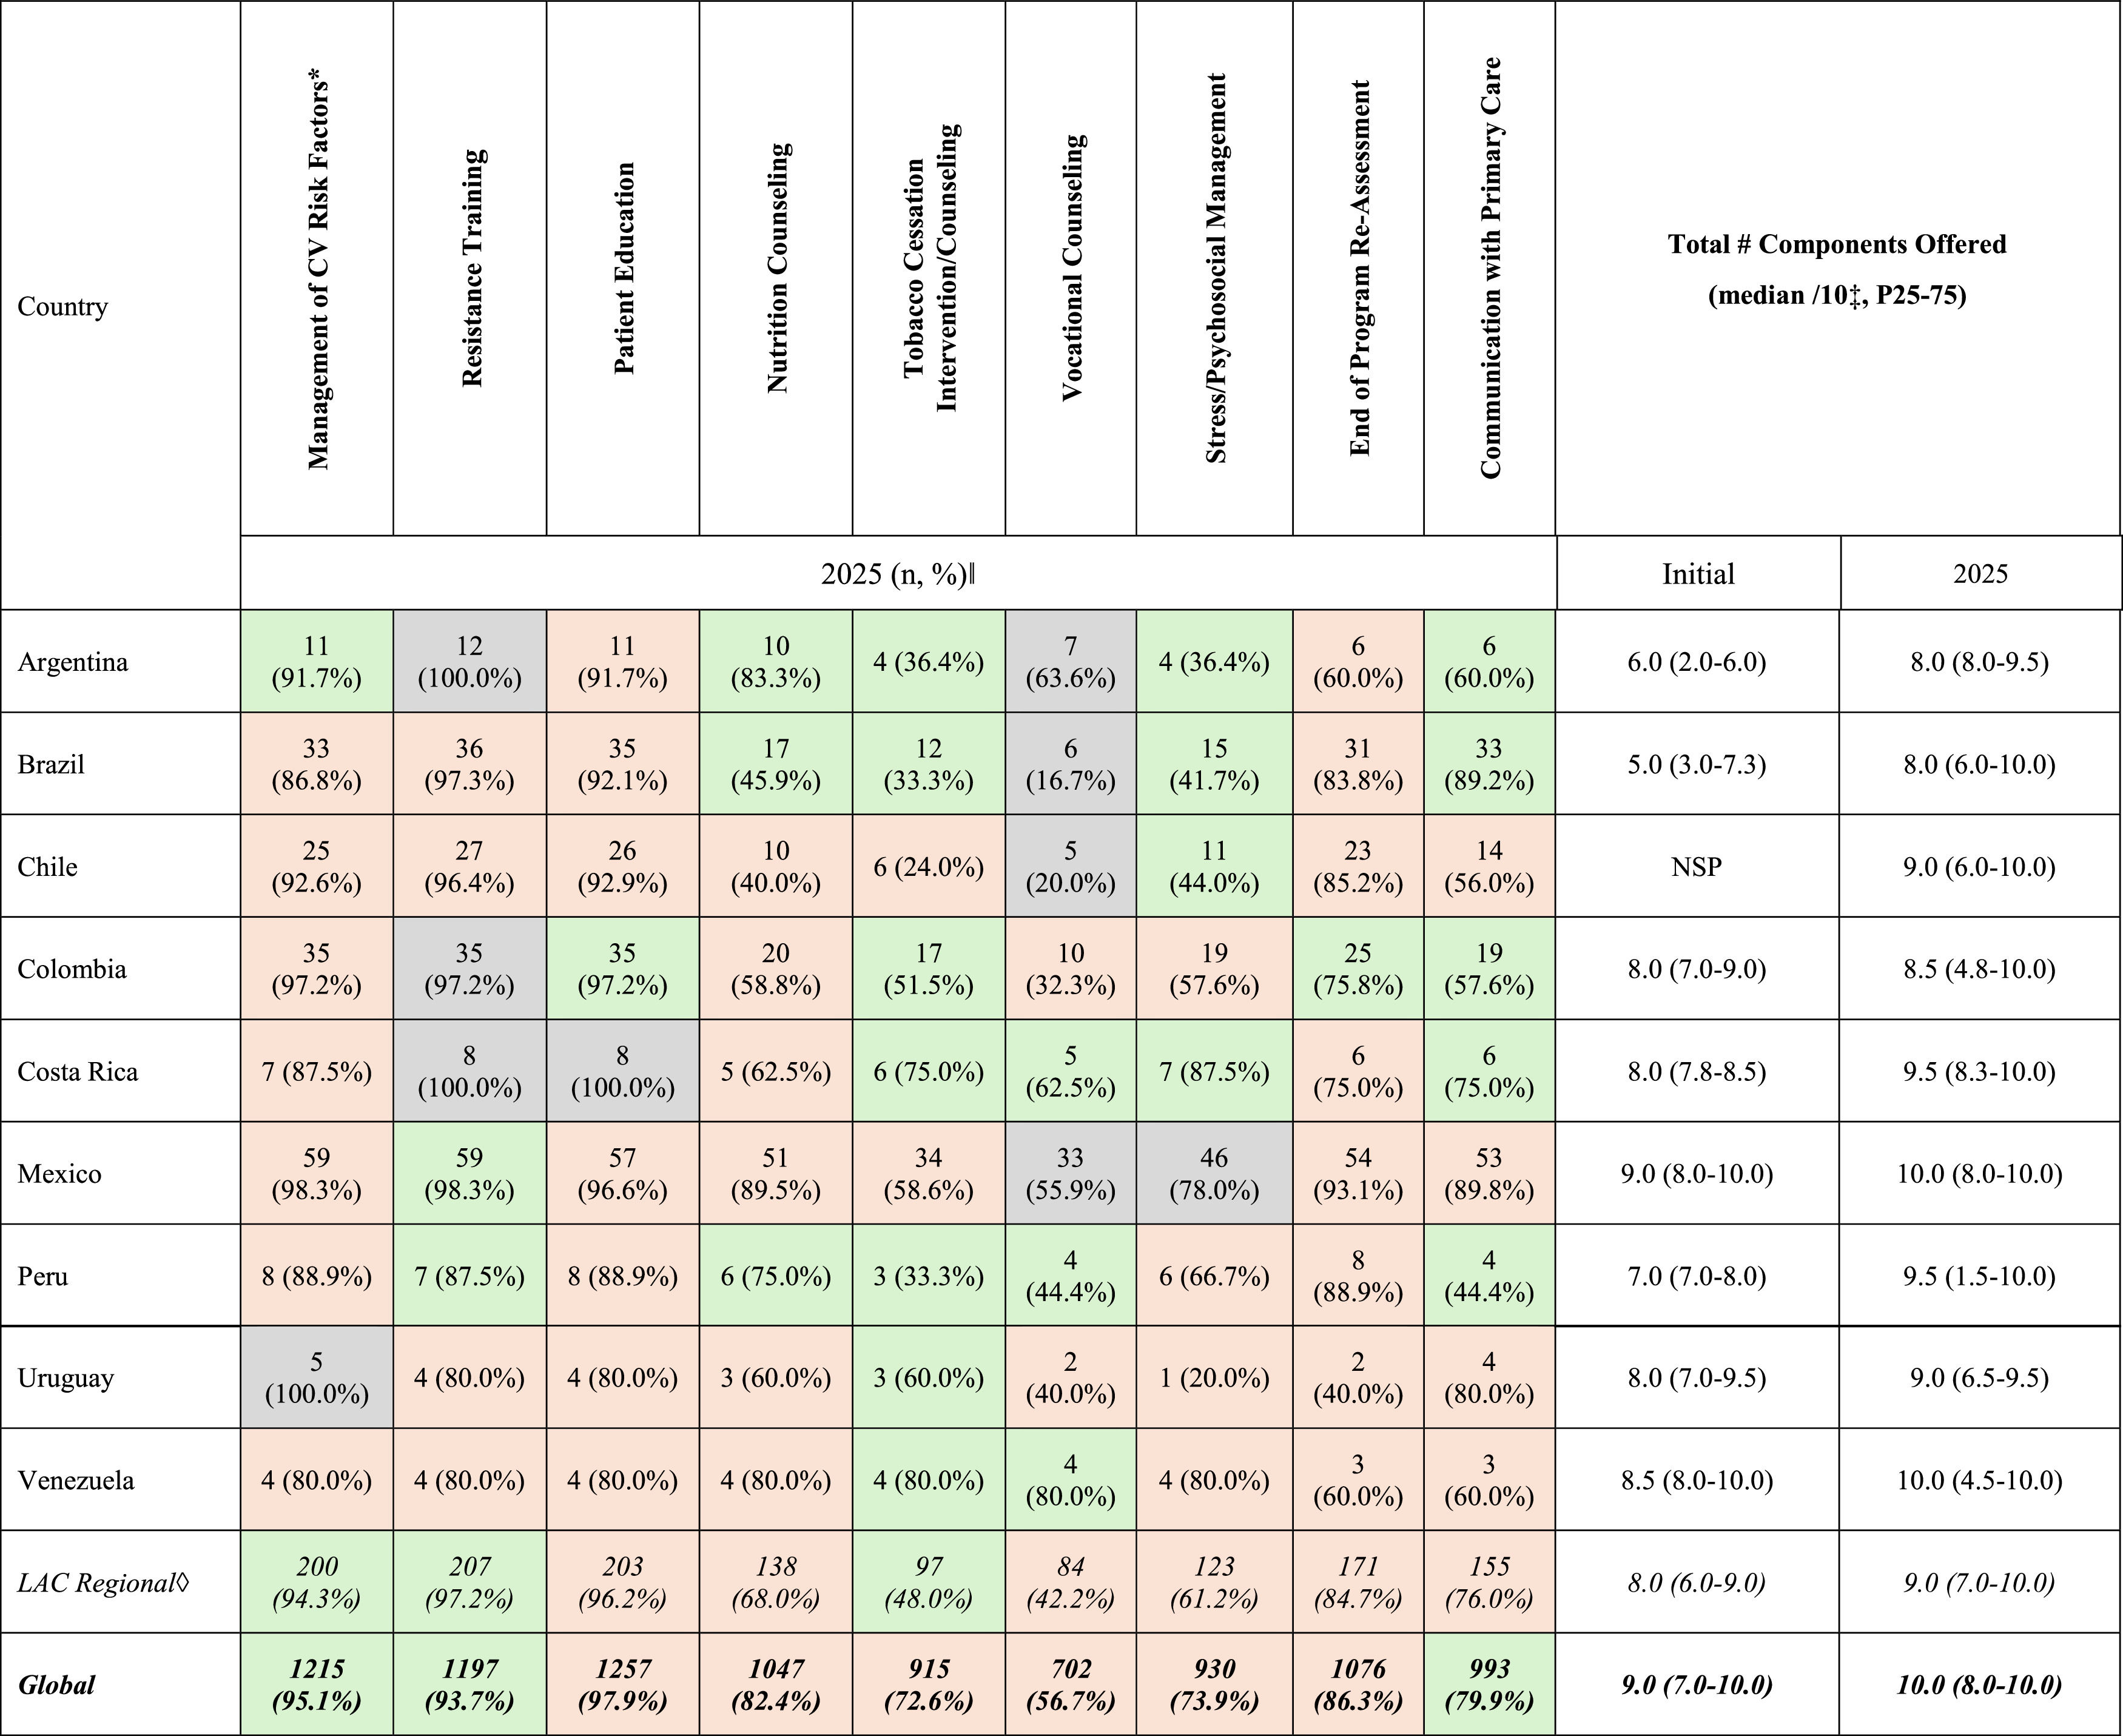
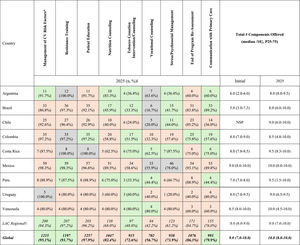
Components deliveredCore components offered by CR programs in LAC by these specialized personnel are presented in Table 4 by country. Overall, the median number of core components delivered per program was high and consistent from 2016 (8/10) to 2025 (9/10), as well as consistent the with the global median in 2025 (10). Exercise prescription, resistance training, and patient education were almost universally implemented across LAC programs (> 94%), and ∼85% of programs completed end-of-program re-assessments. Approximately two-thirds of programs delivered nutrition counseling, and stress/psychosocial management. Tobacco cessation and vocational counseling (43.0% in 2016)9 were the least-frequently offered components. Tobacco cessation intervention was more commonly offered in 2025 vs 2016, however it still appears to be offered much less frequently than it is globally. Nutrition counselling also appears to be less frequent in LAC than globally.
Core cardiac rehabilitation components† by LAC country with ≥3 responding programs◊ and globally, as well as difference from initial 2016 Audit.9.
Note: valid percentages are reported.
ǁCells shaded in green indicate an increase compared to the 2016 Global Audit,9 orange a decrease, and grey no change.
*e.g., hypertension, hypercholesterolemia, diabetes.
†initial assessment and structured exercise training were inclusion criteria, so are not shown.
‡sum of all 9 components shown above plus initial assessment.
◊data not shown to protect program privacy in countries with only 1 program or due to small cell sizes rendering estimates unreliable (≤3 programs responding). Available values included in LAC region summary row to optimize generalizability.
Acronyms: CV, cardiovascular; LAC, Latin America and the Caribbean.
During initial assessment, major risk factors assessed are shown in Supplemental Table S2. Nearly all programs in LAC assessed blood pressure, physical activity, and tobacco use (99.1–96.7%), with high rates for harmful use of alcohol or drugs, poor diet, blood glucose, and lipids as well (89.2–86.0%). Sleep apnea was the least-commonly assessed factor (70.6%), but was more commonly assessed than in 20169 and rates were similar to those observed globally. Overall, compared with 2016,9 a modest increase was observed for depression and blood glucose assessment by programs as well. Brazil and Peru appeared to have improved risk factor assessment comprehensiveness, with Chile and Venezuela somewhat worse. Risk factor assessment rates were quite high and consistent with those globally (body composition higher in LAC; Table S2).
Specifically regarding patient education, again nearly all CR programs in LAC reported providing formal patient education (by country in Table 4; lowest in Uruguay and Venezuela). While some programs reported as few as 30 min of total formal education, while others offered up to 5 h, the median number of education sessions delivered per patient was 4 (P25-P75=1–10), each lasting a median of 30 min (P25-P75=20–60). This corresponds to a median total education dose of 2.0 h per program (P25-P75=1.0–5.0). Compared to education dose offered globally (median=3.0 h; P25–P75=1.0–7.0),16 education dose in LAC programs was slightly lower.
CR dose, by modelAs shown in Table 3 by country and region, a median of 3 sessions per week are offered in centre-based CR in LAC over a median of 11 weeks (∼3 months), corresponding to 25 total sessions/patient/program. Programs were considerably shorter in Mexico as well as Chile and Venezuela, and longest in Argentina. Compared to the 2016 Audit,9 LAC programs now offer fewer weeks of CR at similar weekly frequency (consistent with global norms in 2016 as well). As also shown in Table 3, total centre-based dose was consistent with that offered globally in 2025.
In alternative models, which as outlined above are offered more frequently in the current era, the median session frequency offered by programs was 2 per week over 9 weeks, for a total of 12 sessions/patient (Table 3); duration was considerably longer in Colombia. This was consistent with other countries globally, but represented a statistically significant decrease in total sessions per program since the 2016 Audit9 (p = 0.03; Table 3; note alternative model dose also declined across programs globally in this same interval).
DiscussionHerein the most current and comprehensive characterization of CR delivery across LAC countries is provided with global comparisons, also providing an update a decade after the initial ICCPR Global Audit.9 Since 2016, the number of CR programs in LAC has increased modestly - from 139 to 255 programs – yet still span only approximately 70% of countries in the region; there are 10 countries in the region having no CR, with almost 15,000 patients unserved annually in Ecuador alone which no longer has any CR.
The greatest service shortfalls continue to be observed in Brazil and Mexico, with a total LAC regional shortfall estimated at −635,945 patients/year. While there was wide national variation, median CR coverage by country across the region was only 3% of patients in need. Along with Brazil, Dominican Republic and Bolivia were ranked among the countries with the worst coverage globally. With regard to patient-level CR access where programs do exist, programs estimate only 6% of indicated cardiac inpatients are systematically referred, and 55% of patients are paying out-of-pocket, although total CR program delivery costs are substantively lower in the region than globally. Overall, these results highlight that, although LAC has made incremental progress, the region continues to face a large and inequitable CR gap.
Programs treated approximately 113 patients/year (without imputation), with a team of 5 staff, primarily physiotherapists, nurses, and more allied healthcare professionals than a decade earlier. LAC programs were very thorough in patient risk factor assessment, with increases in assessment of blood glucose and depression from 2016; rates were consistent with those globally, but LAC programs outperformed other countries in adiposity assessment. Patients were delivered very comprehensive programs, with a modest 2 h or patient education, although delivery of tobacco cessation interventions and return-to-work counselling remained too low, as they are globally. Finally, while highly variable, overall regional CR dose of 25 sessions/patient in supervised programs was less than that a decade earlier, but consistent with the global median. Further analysis of the nature of CR services and staffing in the region is found in the Supplemental Discussion.
ImplicationsThe under-availability of CR represents a major missed opportunity to improve secondary prevention outcomes and reduce the burden of CVD. Given robust evidence demonstrating the low healthcare cost to the system (not for patients in the region) and cost-effectiveness of CR,28 morbidity and mortality reduction,29 as well as quality-of-life benefits,30 the lack of sufficient services contributes to preventable disability and death across LAC. While CR program capacity has expanded in some countries in the last decade, the magnitude of service shortfalls underscores the urgent need for health systems to integrate CR into national CVD and non-communicable disease management policies.31
Despite relatively robust multidisciplinary staffing17 and a comprehensive suite of core components offered,16 participation continues to be constrained by limited referral systems, persistent out-of-pocket costs, and sparse availability of alternative or community-based models that could improve reach. The high patient cost burden may exacerbate socioeconomic inequities in access and undermine the potential of CR to mitigate CVD burden region-wide. Expanding CR coverage and optimizing delivery require coordinated action between Ministries of Health, health governance bodies at all levels, professional Associations, and community organizations. Professional Societies, including the ICCPR and local cardiovascular organizations, should continue to champion CR inclusion in policy, accreditation standards, and workforce training initiatives. Strategic investment is needed to expand coverage, particularly in underserved areas, and to include hybrid/alternative CR models within existing reimbursement structures (only reimbursed for 18.1% programs currently). Integrating CR into publicly-funded health benefit packages, establishing referral mandates within hospital discharge processes and leveraging digital technologies represent actionable opportunities to reduce unmet need and increase utilization.
LimitationsSeveral limitations warrant consideration. Although the country response rate was high, challenges in program identification (e.g., private sector programs not linked to Societies, programs that re-branded post-COVID) may have introduced bias. It is unknown how non-identified programs differ from responding programs. Moreover, the number of programs in many countries was small, which may limit the stability and generalizability of country-level estimates.
Caution is warranted in interpretation of PPP costing values, given PPP compression effects in MICs, public-sector subsidization of CR staff and infrastructure when compared to privately-funded health care, internalization of costs in public health systems, and inflation instability in some countries.
As with prior Audits,9 heterogeneity in health system structures, economic conditions, and data completeness across countries may affect the generalizability of results. Findings should thus be interpreted with caution and viewed as exploratory, emphasizing trends rather than definitive inter-country comparisons. Similar caution is warranted when interpreting changes from 2016 due to measurement modifications and the repeated cross-sectional design.
ConclusionIn this 2025 Audit Update, CR availability and delivery in LAC show areas of important progress, yet substantial inequities and service gaps persist. While several countries have expanded program numbers, strengthened multidisciplinary teams, and maintained delivery of most guideline-recommended core components, referral practices remain inconsistent, alternative models are under-available, and patient out-of-pocket costs continue to pose major barriers to access. Comparison with global estimates and the initial Audit reveals modest improvements in some domains but persistent or widening shortfalls in others, resulting in an annual service shortfall reaching well over 600,000 indicated patients. Taken together, these findings highlight the urgent need for coordinated regional policies, sustainable funding mechanisms, improved referral systems, and wider adoption of hybrid or home-based models to ensure equitable, scalable CR services capable of addressing the growing secondary prevention needs across the region.
Authors contributionsConceptualization: GLMG, SLG. Resources: GLMG, SLG, KTA. Data curation: GLMG. Formal analysis: GLMG, RPC. Supervision: GLMG, SLG, KTA. Investigation: GLMG, SLG. Methodology: GLMG, KTA, SLG. Writing original draft: GLMG, SLG. Writing – review and editing: GLMG, RC, CA, MCR, RF, DFG, JM, PS, KTA, MPJ, LM, MS, RPC, SLG. Visualization: GLMG.
FundingFunding to Drs. Karam Turk-Adawi from Qatar University International Research Collaboration Co-Fund with York University (funding to Sherry Grace), Toronto Canada (IRCC-2025-648), and funding to Prof. Sherry L. Grace from Faculty Mobility for Partnership Building Program, of Global Affairs Canada.
The authors declare no competing interest.
For their support in identifying and reaching CR programs as well as interpreting results, we are also grateful to the Association ASSOBRAFIR (Brazilian Association of Cardiorespiratory Physiotherapy and Intensive Care Physiotherapy) and the Heart and Stroke Foundation of Barbados, as well as to the following individuals: Drs. Thomas Allison, Rachael Andrew, Simone Barton, Elida Batista-Herrera, Briseida Benaim, Lizzy M. Brewster, Francisco Bentz Brugal, Noel Botha, Gabriela Fajardo, Carlos Enrique Franco, Graciela Gonzalez, Shanice Jones, Casper Laclé, Georgette Meade, Eduardo Rivas-Estany, Luis Arturo Rodriguez, Ascela Vasquez Briceño, Martin Vasquez, Riley Vincent, Eric Vinck Geerman, Juan E Uriona Villarroel, Rafaelina Concepcion and Derys Agustin Valeria Vasquez. We are grateful to Ms. Nada Arar for assistance with Table 2. Generative AI was used for editing assistance.