
To compare men and women with low back pain and identify the prevalence and some of its associated factors in a population-based sample of adults aged 20 and over a seven day period.
MethodsCross-sectional study based on a population survey. 600 individuals were interviewed on the following: (1) characteristics of the participants (i.e. demographic, socioeconomic, and labor aspects); (2) physical activity level (IPAQ); (3) musculoskeletal symptoms (Nordic Questionnaire). Descriptive, bivariate, and Poisson regression analyses were performed.
ResultsOverall prevalence of LBP was 28.8%, being 39.0% in men and 60.9% in women. The measured associated factors in men were age between 36 and 59 years (PR=3.00 [1.31–6.88]) and over 60 (PR=4.52 [2.02–10.12]), smoking (PR=2.47 [1.20–5.11]), fewer years of formal education (0–4 years) (PR=6.37 [2.15–18.62]), and hypertension (PR=2.27 [1.15–4.50]). For women, the associated factors were occupational activities that involved heavy lifting (PR=1.80 [1.03–3.16]), standing posture leaning forward (PR=2.04 [1.20–3.44]), sitting posture leaning forward (PR=2.17 [1.24–3.82]), and sitting at the computer three or more days per week (PR=4.00 [1.44–11.11]). Widowed or divorced participants were more likely to report LBP, in both men (PR=3.06 [1.40–6.66]) and women (PR=2.11 [1.15–3.88]).
ConclusionThis study reveals high prevalence of low back pain in a seven day period. Older age, low education, hypertension, and smoking were associated with LBP in men. Occupational and ergonomic factors were associated with LBP in women. Marital status was associated with LBP in both genders.
Low back pain (LBP) is the leading cause of disability among adults of all ages. According to the World Health Organization (WHO), musculoskeletal morbidities are the most disabling conditions.1 Of the 291 health conditions surveyed in the Global Burden of Disease 2010 study (GBD 2010), LBP contributed the most to overall disability and ranked sixth in terms of global burden of disease measured by Disability-Adjusted Life Years.2
The GBD study also showed that LBP had a global point prevalence of 9.4%, being higher in men (10.1%) compared to women (8.7%). This same study showed that prevalence was higher in the western Europe (15.0%), followed by North Africa/Middle East (14.8%) and (6.5%) followed by Central Latin America (6.6%).2 In Brazil, a systematic review showed that the prevalence rate for a seven day period was 4.2–31.4% and, in the last year, it was 13.1–66.8%. Also, it revealed that the prevalence rate in adults in the last year was greater than 50%, from 13.1% to 19.5% in adolescents, and prevalence rates of 4.2% to 14.7% for chronic low back pain in the general population.3
LBP is an important cause of morbidity and disability in many countries. LBP can affect the individual, physical, social, and psychological aspects contributing to increased costs for business, government, and society. The evidence indicates4–6 significant differences between genders regarding the prevalence of LBP, the degree of disability generated by LBP, and the number of comorbidities, which were higher in women. Some studies that investigated strategies for coping with LBP have suggested that women deal with pain in a more flexible and creative way, while men use maladaptive strategies such as catastrophizing.7 In addition, most epidemiological studies on LBP come from European countries, particularly Scandinavian countries and specific populations.8 There are few population-based studies in Brazil comparing the pain experience between men and women with LBP.3
Knowledge about the prevalence and factors associated with LBP in the different genders could contribute to the research in the area, leading to new hypotheses in search for a better understanding of LBP. Thus, the aim of this study is to compare men and women with and without LBP and to identify the prevalence of this condition and some of its associated factors in a population-based sample of adults aged 20 and over a one week period prior to assessment.
MethodsDesign and sampleThis is a cross-sectional study based on data from a previous study “Musculoskeletal Symptoms, Autonomy and Quality of Life in the Population of Bauru, São Paulo” carried out in the city of Bauru, SP, Brazil. Ethics approval was obtained from the Human Research Ethics Committee of Universidade do Sagrado Coração (approval no. 957.481). All participants signed an informed consent form.
The participants were divided into groups according to age and gender, called sample domains. Six sample domains were determined: 20- to 35-year-old males; 20- to 35-year-old females; 36- to 59-year-old males; 36- to 59-year-old females; ≥60-year-old males; and ≥60-year-old females. A minimum number of participants were guaranteed for each domain to allow further analysis.
We based our sample size calculation on the following assumptions: an estimated proportion of 50% of the population subgroups, given that this is the maximum variability that leads to conservative sample sizes; a 95% confidence level in the estimation of confidence intervals; a 10% sampling error, indicating that the amplitude between the estimated sample and the population parameter should not exceed this value; a design effect (deff) of 2. Therefore, the sample size for each age group (20–35 years, 36–59 years and 60 years or more was at least 200 individuals (100 males and 100 females), totalling 600 participants living in the city of Bauru, SP, Brazil.
The sample was randomly selected using a two-stage cluster design. The sampling units were obtained from the 2011 National Household Sample Survey, which provided a list of the private addresses in each census tract. Fifty urban census tracts were randomly selected from the 476 identified tracts. The census tracts constituted the primary sampling units (PSUs). The households were the secondary sampling units (SSUs). The PSUs were randomly selected by systematic sampling with a probability proportional to their sizes.9,10
For each census tract, the number of households to be randomly selected was determined according to the ratio of the average number of individuals per number of households in each sample domain.9 It was estimated, therefore, that about 12 households per census tract should be visited. These households were randomly selected using a system that considered all eligible individuals residing in the households. In households with more than one eligible subject, all subjects within each groups age range were considered eligible for the interviews. In case of refusal of one or all subjects, a new household was randomly selected. The individuals who refused to answer the questionnaire by personal choice were considered as refusals.
Individuals not located after four visits were considered as a loss. In these cases, at least one visit was attempted at night and one on the weekend. Those who were unable to respond due to travel or who refused to answer the questionnaire by personal choice were also considered as a loss.
Data collection proceduresInterviews were conducted by trained interviewers and fieldwork was supervised by the researchers involved in the study. Data collection took place between February and June 2012. The coding was performed by the interviewers and reviewed by the chief researcher. Supervisors also performed quality control, which consisted of applying a short version of the questionnaires to 10% of respondents.11 Individuals with mental health issues were excluded from the study. Older participants were asked to do the Mini-Mental State Examination at the beginning of the interview and those who scored below 27 were considered as having cognitive loss and therefore were excluded from the study.10
InstrumentsThe following demographic characteristics of the participants were collected: gender (male and female), age, marital status (married or de facto, single, separated, or widowed), and skin color (white, black, brown, Asian or indigenous). The following socioeconomic aspects were also collected: education (number of years in school) and income (Class E=up to 1 minimum wage, Class D=1–5 times the minimum wage, Class C=5–10 times the minimum wage, Class B=10–20 times the minimum wage, Class A=more than 20 times the minimum wage).
Physical activity level was verified using the International Physical Activity Questionnaire (IPAQ),12,13 short version, which contained questions regarding weekly frequency and duration in minutes per day of vigorous and/or moderate physical activity and walking. The questionnaire was validated for the Brazilian population.14 A cut-off point of 150min per week was used to classify the subjects as active (150min/wk or more) or insufficiently active (below 150min/wk).15,16
Regarding sedentary activities (time watching TV and on the computer and/or video games), the following questions were asked: “In a normal week do you watch TV?” (Yes or No); “In a normal week, how often do you watch TV?” (twice or less, three to four times, or five times or more per week); “On a typical day, how many hours do you watch TV?” (up to two hours or over three hours a day); “In a normal week, how often do you use a computer or a video game?” (up to twice, three to four times, five times or more per week); “On a typical day, how many hours do you use a computer or a video game?” (up to two hours, over three hours a day).17
The ergonomic variables were characterized from the perception of the subjects, who selected from four options (i.e., never, rarely, usually, always) the option that best described their frequency of exposure during a work day. Variables analyzed included repetitive movements, heavy lifting, vibration/tremor during the working day, sitting position, sitting position leaning forward, sitting position carrying weight, standing posture, standing posture flexed forward, kneeling, and lying down. In order to define the association between LBP and ergonomic variables, the frequencies obtained in the “never” and “rarely” categories were combined and categorized into a single group, and the categories “usually” and “always” were also combined into another group.11
Smokers were those who reported smoking daily (at least one cigarette per day) or occasionally (less than one cigarette per day) or former smokers who had stopped smoking for at least six months prior to the interview.11 In addition, morbidity information was collected through an interview in which subjects answered the question: “Among the alternatives below (hypertension, diabetes, respiratory, gastrointestinal and urinary tract diseases), choose the one that corresponds to a diagnosis received from a physician in the last 12 months”.18
The question used to define the outcome of LBP was: “In the past seven days, have you had any pain or discomfort in the lower back?”. In the present study, LBP was defined as the presence of an existing or acquired problem (pain, discomfort, or numbness) in the low back region in the last seven days. Respondents who answered yes had to indicate the site on a drawing of the human body with the anatomical regions (cervical, thoracic, lumbosacral spine) identified in different colors. This type of tool was valid and reliable for measuring pain in the general population because it identified the precise location of the pain.11,19
Statistical analysisData were entered into a database and analyses were stratified by gender using the statistical software SPSS, version 10.0 (SPSS, Chicago, IL, USA). A descriptive analysis was presented with the prevalence for all variables included in the study and their respective confidence intervals. For the initial analysis, the prevalence of LBP was verified according to groups of independent variables, presenting relative risks, confidence intervals, and p values. The multivariate analysis was performed using Poisson regression, with robust variance, respecting a hierarchical model of relations between variables.20,21
ResultsFor the households randomly selected, 641 eligible individuals were identified and 600 individuals were interviewed. The main reasons for the losses (n=21) were: “participant absent from home” and “participant set a time with the interviewer but did not show”. The refusals were “participant who did not respond to interview request” (n=12) and “mental disability” (n=8). The majority of participants had between nine and 11 years of formal education, were white, married, of low income, non-smokers, and suffered from both hypertension and diabetes mellitus.
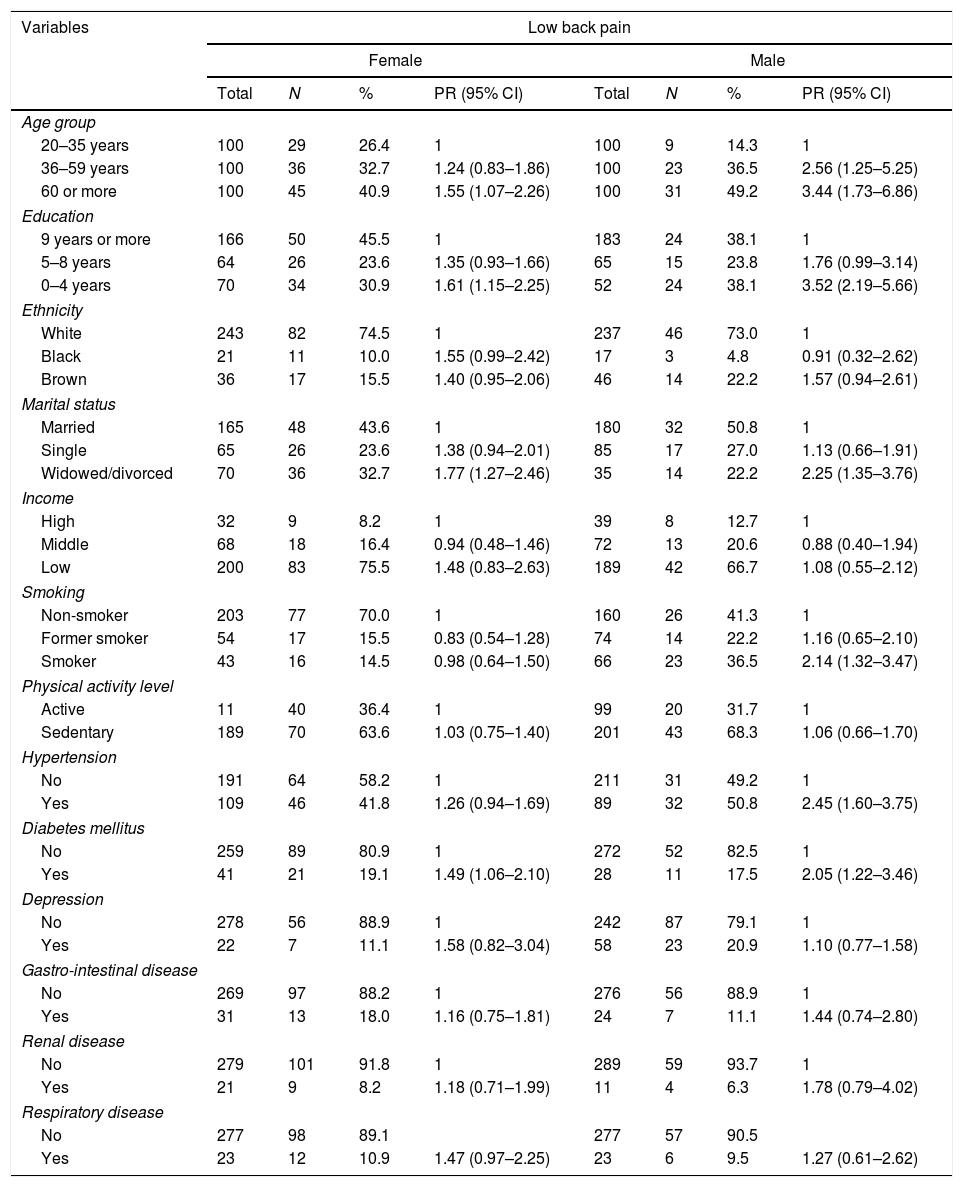
Of the total sample, 28.8% (95% CI 30.4–38.0) reported LBP at least once in the seven days prior to the interview. Of these, 39.1% (95% CI 95% 32.6–45.8) were men and 60.9% (95% CI 54.1–67.3) were women (p=0.001). For both genders, LBP was associated with the following variables: age range, formal education from 0 to 4 years, being widowed/divorced, and being hypertensive and diabetic. For men, there was an association with smoking (Table 1).
Prevalence of low back pain in males and females based on sociodemographic characteristics, smoking, physical activity level, and reported diseases.
| Variables | Low back pain | |||||||
|---|---|---|---|---|---|---|---|---|
| Female | Male | |||||||
| Total | N | % | PR (95% CI) | Total | N | % | PR (95% CI) | |
| Age group | ||||||||
| 20–35 years | 100 | 29 | 26.4 | 1 | 100 | 9 | 14.3 | 1 |
| 36–59 years | 100 | 36 | 32.7 | 1.24 (0.83–1.86) | 100 | 23 | 36.5 | 2.56 (1.25–5.25) |
| 60 or more | 100 | 45 | 40.9 | 1.55 (1.07–2.26) | 100 | 31 | 49.2 | 3.44 (1.73–6.86) |
| Education | ||||||||
| 9 years or more | 166 | 50 | 45.5 | 1 | 183 | 24 | 38.1 | 1 |
| 5–8 years | 64 | 26 | 23.6 | 1.35 (0.93–1.66) | 65 | 15 | 23.8 | 1.76 (0.99–3.14) |
| 0–4 years | 70 | 34 | 30.9 | 1.61 (1.15–2.25) | 52 | 24 | 38.1 | 3.52 (2.19–5.66) |
| Ethnicity | ||||||||
| White | 243 | 82 | 74.5 | 1 | 237 | 46 | 73.0 | 1 |
| Black | 21 | 11 | 10.0 | 1.55 (0.99–2.42) | 17 | 3 | 4.8 | 0.91 (0.32–2.62) |
| Brown | 36 | 17 | 15.5 | 1.40 (0.95–2.06) | 46 | 14 | 22.2 | 1.57 (0.94–2.61) |
| Marital status | ||||||||
| Married | 165 | 48 | 43.6 | 1 | 180 | 32 | 50.8 | 1 |
| Single | 65 | 26 | 23.6 | 1.38 (0.94–2.01) | 85 | 17 | 27.0 | 1.13 (0.66–1.91) |
| Widowed/divorced | 70 | 36 | 32.7 | 1.77 (1.27–2.46) | 35 | 14 | 22.2 | 2.25 (1.35–3.76) |
| Income | ||||||||
| High | 32 | 9 | 8.2 | 1 | 39 | 8 | 12.7 | 1 |
| Middle | 68 | 18 | 16.4 | 0.94 (0.48–1.46) | 72 | 13 | 20.6 | 0.88 (0.40–1.94) |
| Low | 200 | 83 | 75.5 | 1.48 (0.83–2.63) | 189 | 42 | 66.7 | 1.08 (0.55–2.12) |
| Smoking | ||||||||
| Non-smoker | 203 | 77 | 70.0 | 1 | 160 | 26 | 41.3 | 1 |
| Former smoker | 54 | 17 | 15.5 | 0.83 (0.54–1.28) | 74 | 14 | 22.2 | 1.16 (0.65–2.10) |
| Smoker | 43 | 16 | 14.5 | 0.98 (0.64–1.50) | 66 | 23 | 36.5 | 2.14 (1.32–3.47) |
| Physical activity level | ||||||||
| Active | 11 | 40 | 36.4 | 1 | 99 | 20 | 31.7 | 1 |
| Sedentary | 189 | 70 | 63.6 | 1.03 (0.75–1.40) | 201 | 43 | 68.3 | 1.06 (0.66–1.70) |
| Hypertension | ||||||||
| No | 191 | 64 | 58.2 | 1 | 211 | 31 | 49.2 | 1 |
| Yes | 109 | 46 | 41.8 | 1.26 (0.94–1.69) | 89 | 32 | 50.8 | 2.45 (1.60–3.75) |
| Diabetes mellitus | ||||||||
| No | 259 | 89 | 80.9 | 1 | 272 | 52 | 82.5 | 1 |
| Yes | 41 | 21 | 19.1 | 1.49 (1.06–2.10) | 28 | 11 | 17.5 | 2.05 (1.22–3.46) |
| Depression | ||||||||
| No | 278 | 56 | 88.9 | 1 | 242 | 87 | 79.1 | 1 |
| Yes | 22 | 7 | 11.1 | 1.58 (0.82–3.04) | 58 | 23 | 20.9 | 1.10 (0.77–1.58) |
| Gastro-intestinal disease | ||||||||
| No | 269 | 97 | 88.2 | 1 | 276 | 56 | 88.9 | 1 |
| Yes | 31 | 13 | 18.0 | 1.16 (0.75–1.81) | 24 | 7 | 11.1 | 1.44 (0.74–2.80) |
| Renal disease | ||||||||
| No | 279 | 101 | 91.8 | 1 | 289 | 59 | 93.7 | 1 |
| Yes | 21 | 9 | 8.2 | 1.18 (0.71–1.99) | 11 | 4 | 6.3 | 1.78 (0.79–4.02) |
| Respiratory disease | ||||||||
| No | 277 | 98 | 89.1 | 277 | 57 | 90.5 | ||
| Yes | 23 | 12 | 10.9 | 1.47 (0.97–2.25) | 23 | 6 | 9.5 | 1.27 (0.61–2.62) |
PR, prevalence ratios; CI, confidence intervals.
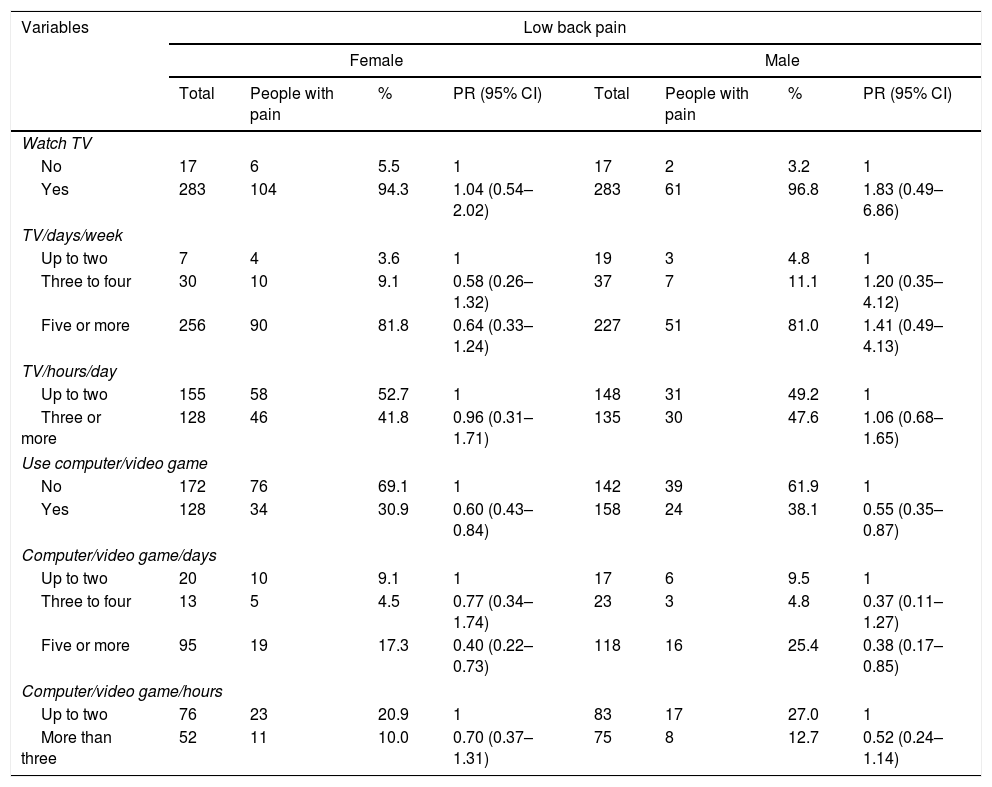
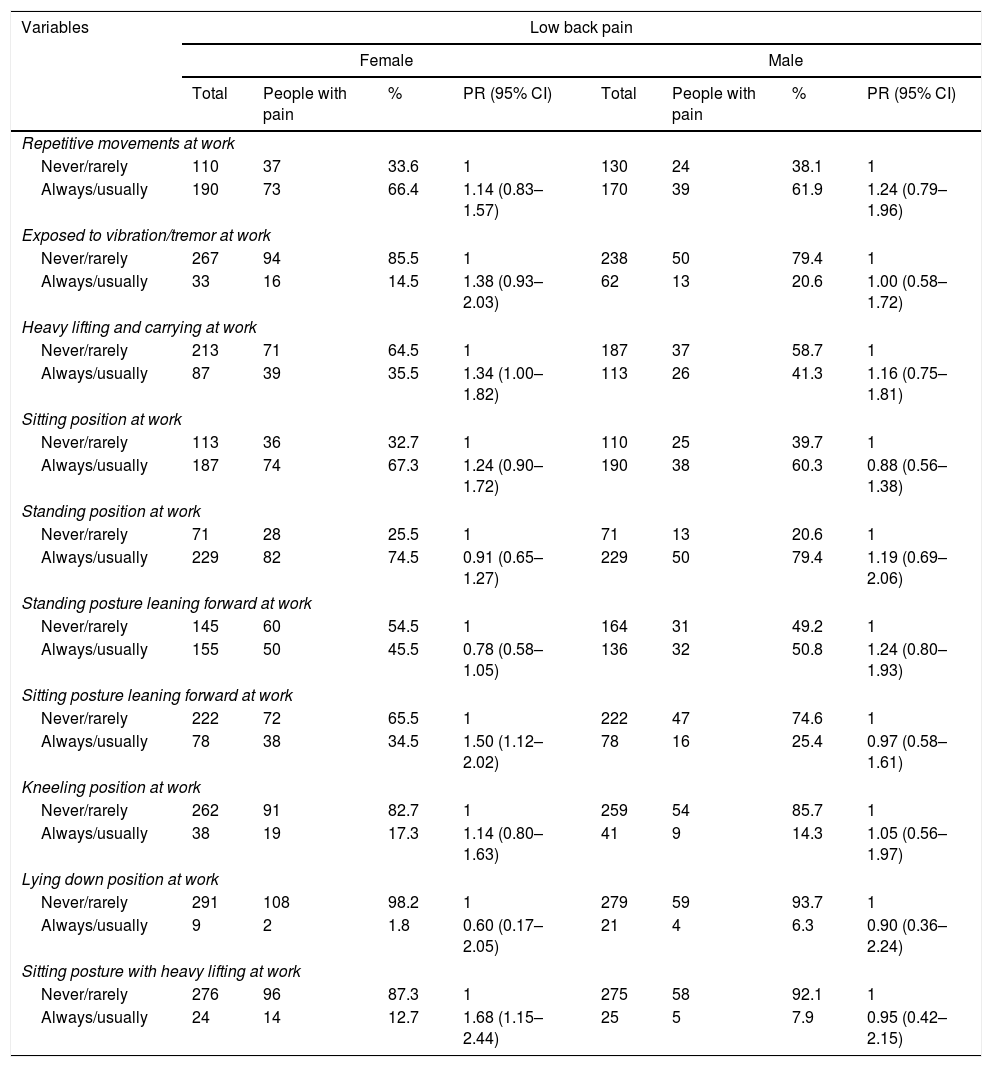
Variables related to sedentary activities were not associated with LBP in males or females (Table 2). Finally, for females, LBP was significantly associated with heavy lifting, sitting position carrying weight, and sitting position leaning forward (Table 3).
Prevalence of low back pain in males and females during sedentary activities.
| Variables | Low back pain | |||||||
|---|---|---|---|---|---|---|---|---|
| Female | Male | |||||||
| Total | People with pain | % | PR (95% CI) | Total | People with pain | % | PR (95% CI) | |
| Watch TV | ||||||||
| No | 17 | 6 | 5.5 | 1 | 17 | 2 | 3.2 | 1 |
| Yes | 283 | 104 | 94.3 | 1.04 (0.54–2.02) | 283 | 61 | 96.8 | 1.83 (0.49–6.86) |
| TV/days/week | ||||||||
| Up to two | 7 | 4 | 3.6 | 1 | 19 | 3 | 4.8 | 1 |
| Three to four | 30 | 10 | 9.1 | 0.58 (0.26–1.32) | 37 | 7 | 11.1 | 1.20 (0.35–4.12) |
| Five or more | 256 | 90 | 81.8 | 0.64 (0.33–1.24) | 227 | 51 | 81.0 | 1.41 (0.49–4.13) |
| TV/hours/day | ||||||||
| Up to two | 155 | 58 | 52.7 | 1 | 148 | 31 | 49.2 | 1 |
| Three or more | 128 | 46 | 41.8 | 0.96 (0.31–1.71) | 135 | 30 | 47.6 | 1.06 (0.68–1.65) |
| Use computer/video game | ||||||||
| No | 172 | 76 | 69.1 | 1 | 142 | 39 | 61.9 | 1 |
| Yes | 128 | 34 | 30.9 | 0.60 (0.43–0.84) | 158 | 24 | 38.1 | 0.55 (0.35–0.87) |
| Computer/video game/days | ||||||||
| Up to two | 20 | 10 | 9.1 | 1 | 17 | 6 | 9.5 | 1 |
| Three to four | 13 | 5 | 4.5 | 0.77 (0.34–1.74) | 23 | 3 | 4.8 | 0.37 (0.11–1.27) |
| Five or more | 95 | 19 | 17.3 | 0.40 (0.22–0.73) | 118 | 16 | 25.4 | 0.38 (0.17–0.85) |
| Computer/video game/hours | ||||||||
| Up to two | 76 | 23 | 20.9 | 1 | 83 | 17 | 27.0 | 1 |
| More than three | 52 | 11 | 10.0 | 0.70 (0.37–1.31) | 75 | 8 | 12.7 | 0.52 (0.24–1.14) |
PR, prevalence ratios; CI, confidence intervals.
Prevalence of low back pain in males and females based on ergonomic or occupational variables.
| Variables | Low back pain | |||||||
|---|---|---|---|---|---|---|---|---|
| Female | Male | |||||||
| Total | People with pain | % | PR (95% CI) | Total | People with pain | % | PR (95% CI) | |
| Repetitive movements at work | ||||||||
| Never/rarely | 110 | 37 | 33.6 | 1 | 130 | 24 | 38.1 | 1 |
| Always/usually | 190 | 73 | 66.4 | 1.14 (0.83–1.57) | 170 | 39 | 61.9 | 1.24 (0.79–1.96) |
| Exposed to vibration/tremor at work | ||||||||
| Never/rarely | 267 | 94 | 85.5 | 1 | 238 | 50 | 79.4 | 1 |
| Always/usually | 33 | 16 | 14.5 | 1.38 (0.93–2.03) | 62 | 13 | 20.6 | 1.00 (0.58–1.72) |
| Heavy lifting and carrying at work | ||||||||
| Never/rarely | 213 | 71 | 64.5 | 1 | 187 | 37 | 58.7 | 1 |
| Always/usually | 87 | 39 | 35.5 | 1.34 (1.00–1.82) | 113 | 26 | 41.3 | 1.16 (0.75–1.81) |
| Sitting position at work | ||||||||
| Never/rarely | 113 | 36 | 32.7 | 1 | 110 | 25 | 39.7 | 1 |
| Always/usually | 187 | 74 | 67.3 | 1.24 (0.90–1.72) | 190 | 38 | 60.3 | 0.88 (0.56–1.38) |
| Standing position at work | ||||||||
| Never/rarely | 71 | 28 | 25.5 | 1 | 71 | 13 | 20.6 | 1 |
| Always/usually | 229 | 82 | 74.5 | 0.91 (0.65–1.27) | 229 | 50 | 79.4 | 1.19 (0.69–2.06) |
| Standing posture leaning forward at work | ||||||||
| Never/rarely | 145 | 60 | 54.5 | 1 | 164 | 31 | 49.2 | 1 |
| Always/usually | 155 | 50 | 45.5 | 0.78 (0.58–1.05) | 136 | 32 | 50.8 | 1.24 (0.80–1.93) |
| Sitting posture leaning forward at work | ||||||||
| Never/rarely | 222 | 72 | 65.5 | 1 | 222 | 47 | 74.6 | 1 |
| Always/usually | 78 | 38 | 34.5 | 1.50 (1.12–2.02) | 78 | 16 | 25.4 | 0.97 (0.58–1.61) |
| Kneeling position at work | ||||||||
| Never/rarely | 262 | 91 | 82.7 | 1 | 259 | 54 | 85.7 | 1 |
| Always/usually | 38 | 19 | 17.3 | 1.14 (0.80–1.63) | 41 | 9 | 14.3 | 1.05 (0.56–1.97) |
| Lying down position at work | ||||||||
| Never/rarely | 291 | 108 | 98.2 | 1 | 279 | 59 | 93.7 | 1 |
| Always/usually | 9 | 2 | 1.8 | 0.60 (0.17–2.05) | 21 | 4 | 6.3 | 0.90 (0.36–2.24) |
| Sitting posture with heavy lifting at work | ||||||||
| Never/rarely | 276 | 96 | 87.3 | 1 | 275 | 58 | 92.1 | 1 |
| Always/usually | 24 | 14 | 12.7 | 1.68 (1.15–2.44) | 25 | 5 | 7.9 | 0.95 (0.42–2.15) |
PR, prevalence ratios; CI, confidence intervals.
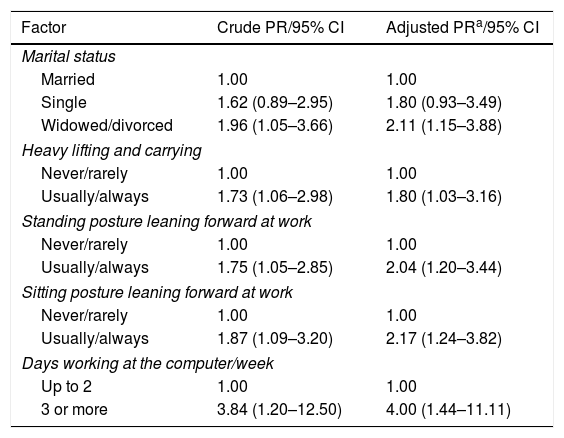
We also found that LBP was associated with age ≥60 years, smoking, hypertension, and formal education between 1 and 4 years and between 5 and 8 years. For women, LBP was associated with occupational activity involving frequent heavy lifting, standing position leaning forward, sitting position leaning forward, and sitting at the computer three or more days a week. For both genders, being widowed or separated was associated with LBP (Tables 4 and 5).
Poisson regression (PR) analysis, final model, for associations between the variables studied and low back pain in women.
| Factor | Crude PR/95% CI | Adjusted PRa/95% CI |
|---|---|---|
| Marital status | ||
| Married | 1.00 | 1.00 |
| Single | 1.62 (0.89–2.95) | 1.80 (0.93–3.49) |
| Widowed/divorced | 1.96 (1.05–3.66) | 2.11 (1.15–3.88) |
| Heavy lifting and carrying | ||
| Never/rarely | 1.00 | 1.00 |
| Usually/always | 1.73 (1.06–2.98) | 1.80 (1.03–3.16) |
| Standing posture leaning forward at work | ||
| Never/rarely | 1.00 | 1.00 |
| Usually/always | 1.75 (1.05–2.85) | 2.04 (1.20–3.44) |
| Sitting posture leaning forward at work | ||
| Never/rarely | 1.00 | 1.00 |
| Usually/always | 1.87 (1.09–3.20) | 2.17 (1.24–3.82) |
| Days working at the computer/week | ||
| Up to 2 | 1.00 | 1.00 |
| 3 or more | 3.84 (1.20–12.50) | 4.00 (1.44–11.11) |
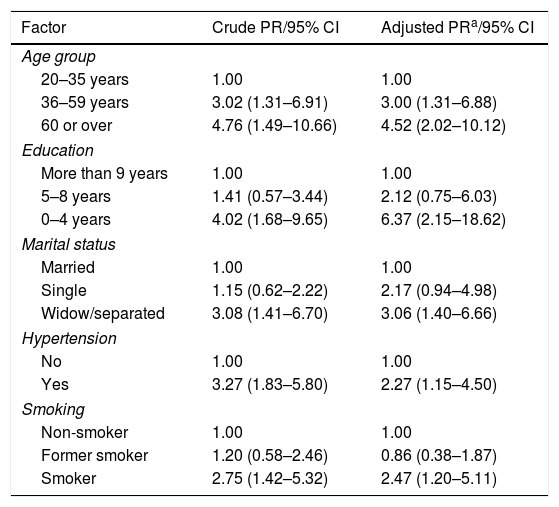
Poisson regression (PR) analysis, final model, for associations between the variables studied and low back pain in men.
| Factor | Crude PR/95% CI | Adjusted PRa/95% CI |
|---|---|---|
| Age group | ||
| 20–35 years | 1.00 | 1.00 |
| 36–59 years | 3.02 (1.31–6.91) | 3.00 (1.31–6.88) |
| 60 or over | 4.76 (1.49–10.66) | 4.52 (2.02–10.12) |
| Education | ||
| More than 9 years | 1.00 | 1.00 |
| 5–8 years | 1.41 (0.57–3.44) | 2.12 (0.75–6.03) |
| 0–4 years | 4.02 (1.68–9.65) | 6.37 (2.15–18.62) |
| Marital status | ||
| Married | 1.00 | 1.00 |
| Single | 1.15 (0.62–2.22) | 2.17 (0.94–4.98) |
| Widow/separated | 3.08 (1.41–6.70) | 3.06 (1.40–6.66) |
| Hypertension | ||
| No | 1.00 | 1.00 |
| Yes | 3.27 (1.83–5.80) | 2.27 (1.15–4.50) |
| Smoking | ||
| Non-smoker | 1.00 | 1.00 |
| Former smoker | 1.20 (0.58–2.46) | 0.86 (0.38–1.87) |
| Smoker | 2.75 (1.42–5.32) | 2.47 (1.20–5.11) |
In this study, the prevalence of LBP was higher in women (60.9%) than in men (39.1%), corroborating data from France,3 Qatar,4 and Saudi Arabia,5 while in Sweden,22 the opposite was observed. LBP was associated with hypertension in males, which corroborates the findings of another study,23,24 however some investigations noted this fact in both genders.25,26 The association restricted to men may have been due to confounding variables related to gender, particularly BMI, and different proportions of muscle and adipose tissue in men and women.23
In the present study, the increase in age was associated with LBP in men, similar to another study,27 whereas in some studies it occurred in both genders,28,29 and in others, there was no such association,30,31 This observed association can be explained by changes due to the aging process, such as postural problems, reduced flexibility, increased musculoskeletal degeneration and, consequently, aggravation of pain.32
Low levels of formal education were associated with LBP in men, similarly to results found in Qatar,3 Austria,9 and France,4 whereas in Turkey,33 no educational association was found. Men with fewer years of formal education were more commonly involved in strenuous physical activities, had less access to health information and services, and were less likely to be involved in health-related activities.34–36
Widowed or separated participants, regardless of gender, presented a higher risk of LBP than single or married participants. The loss of social support may be responsible for an increased risk of developing depression and anxiety, which can have been associated with musculoskeletal conditions such as LBP.37
LBP was associated with smoking in this study, corroborating the results found in Qatar38 and Turkey,33 whereas in studies from Sweden,39 France40 and Canada41 there were no differences between genders. Possible explanations for this association with smoking are that cigarette components cause2 changes in the pH and nutrition of the intervertebral discs by predisposing them to disc herniation,39 reduction in the resistance of the muscles involved with the stabilization of the lumbar spine,42 and interference with the perception of pain.43–45
Ergonomic and occupational factors were significantly associated with LBP in females, similarly to a New Zealand study,10 while investigations in Sweden12 and the Netherlands22 showed that males are also vulnerable to the exposure to work-related risk factors. Possible explanations from the literature are: gender segregation in the workforce, different exposures to the same job or task, differences in the methods used to perform the same task, and differences in coping strategies in relation to stress. In addition, because women generally have more responsibility at home and at work and spend more time performing household tasks than men, they are more likely to be exposed to some risk factors such as inadequate static posture.
This study has some limitations. We did not collect data on the period of menopause in women or on the frequency, severity, intensity, and duration of LBP and we used self-reporting to measure occupational factors. In addition, the cross-sectional design did not allow causal determination. In contrast, the positive aspects of the study were the large sample and the results themselves, which demonstrated the importance of the stratification of the analyses by gender. If stratification had not been performed, several risk factors could have been lost, while some associations would have been mistakenly assumed for both genders, when in fact, they were present only for one gender.
This study showed a high prevalence of LBP in the week prior to assessment. Advanced age, fewer years of formal education, hypertension, and smoking were associated with LBP in men, whereas, work and ergonomic factors were associated with LBP in women. Marital status was associated with LBP in both genders. This study may serve as a reference for other epidemiological investigations and for increasing knowledge on the national estimate of prevalence and risk factors for LBP. This study may also be useful for future systematic reviews and meta-analyses. Longitudinal studies with valid and reliable instruments are needed to estimate the risk factors for LBP in the different genders.10
Conflicts of interestThe authors declare no conflicts of interest.


