
To determine the reliability, internal consistency, measurement error, convergent validity, and floor and ceiling effects of three quality assessment tools commonly used to evaluate the quality of diagnostic test accuracy studies in physical therapy. A secondary aim was to describe the quality of a sample of diagnostic accuracy studies.
Study design and setting50 studies were randomly selected from a comprehensive database of physical therapy-relevant diagnostic accuracy studies. Two reviewers independently rated each study with the Quality Assessment of Diagnostic Accuracy Studies (QUADAS), Quality Assessment of Diagnostic Accuracy Studies 2 (QUADAS-2) and Diagnostic Accuracy Quality Scale (DAQS) tools in random sequence.
ResultsOnly 7% of QUADAS items, 14% of QUADAS-2 items, and 33% of DAQS items had at least moderate inter-rater reliability (kappa>0.40). Internal consistency and convergent validity measures were acceptable (>0.70) in 33% and 50% of cases respectively. Floor or ceiling effects were not present in any tool. The quality of studies was mixed: most avoided case–control sampling strategies and used the same reference standard on all subjects, but many failed to enroll a consecutive or random sample of subjects or provide confidence intervals about estimates of diagnostic accuracy.
ConclusionThe QUADAS, QUADAS-2 and DAQS tools provide unreliable estimates of the quality of studies of diagnostic accuracy in physical therapy.
Diagnostic tests are used in clinical practice to identify pathology and guide decisions such as starting, stopping or modifying treatment.1 Broadly across medicine,2 as well as more specifically in physical therapy,3 the number of diagnostic test accuracy studies is increasing. The methodological quality of these studies is largely unknown.
Numerous quality assessment tools have been developed to evaluate the quality of diagnostic test accuracy studies.4 In 2005, Whiting and colleagues5 identified 67 tools to evaluate the quality of primary diagnostic test accuracy studies. Very few (6 of 67) provided a clear definition of what quality was or what aspects of quality the tool was designed to evaluate.
In physical therapy, the Quality Assessment of Diagnostic Accuracy Studies (QUADAS) tool6 has been used frequently to evaluate quality of primary diagnostic test accuracy studies, particularly for systematic reviews (e.g. [7,8]). A second iteration of this tool, the Quality Assessment of Diagnostic Accuracy Studies 2 (QUADAS-2),9 has also been used frequently in systematic reviews of physical therapy-related diagnostic tests.10,11 A third tool, the Diagnostic Accuracy Quality Scale (DAQS),12 was designed specifically for studies of the diagnostic accuracy of clinical examinations rather than laboratory or imaging tests.
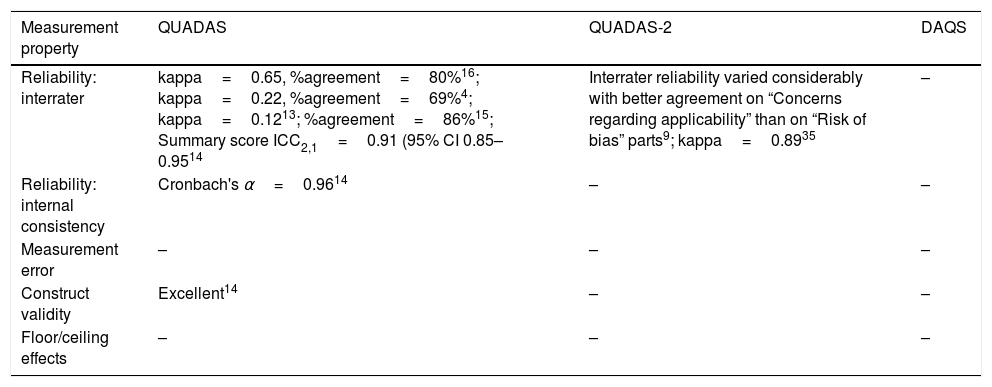
These three tools have undergone varying degrees of evaluation. Table 1 provides a summary of the literature evaluating the measurement properties of these three tools. Many of the tools’ properties have not been investigated and findings about the tools’ properties vary between studies. Reports of head-to-head comparisons of the measurement properties of these tools have not been published.
Summary of published evaluations of the measurement properties of QUADAS, QUADAS-2 and DAQS.
| Measurement property | QUADAS | QUADAS-2 | DAQS |
|---|---|---|---|
| Reliability: interrater | kappa=0.65, %agreement=80%16; kappa=0.22, %agreement=69%4; kappa=0.1213; %agreement=86%15; Summary score ICC2,1=0.91 (95% CI 0.85–0.9514 | Interrater reliability varied considerably with better agreement on “Concerns regarding applicability” than on “Risk of bias” parts9; kappa=0.8935 | – |
| Reliability: internal consistency | Cronbach's α=0.9614 | – | – |
| Measurement error | – | – | – |
| Construct validity | Excellent14 | – | – |
| Floor/ceiling effects | – | – | – |
Most of the evaluations of these tools were conducted during reviews of studies of specific pathologies or populations.9,13–16 A broader review – of systematic reviews of diagnostic test accuracy studies in the subdiscipline of musculoskeletal physical therapy – was recently undertaken.14 However, only the QUADAS tool was assessed in that review and the tool's reliability was evaluated using data from two different reviews of the same primary studies.14 It is unclear which quality assessment tool will perform best when applied to diagnostic test accuracy studies relevant to physical therapy.
The objective of this study is, therefore, to review the measurement properties of QUADAS, QUADAS-2 and DAQS applied to diagnostic test accuracy studies relevant to physical therapy. The study investigates reliability, internal consistency, measurement error, convergent validity, and floor and ceiling effects. A secondary aim is to report on the quality of a representative set of diagnostic test accuracy studies relevant to physical therapy.
MethodsData sourcesStudies of diagnostic test accuracy were randomly selected from those identified in a previous systematic review (n=984; see Appendix 1 for search syntax) of all diagnostic test accuracy studies relevant to physical therapy (manuscript under review).3 A sample size of 50 was selected because this is considered adequate when assessing most measurement properties of quality assessment tools.17
Study eligibilityPapers were included in the previous systematic review3 if they were full primary research papers investigating an index test a physical therapist would perform themselves. This excluded papers studying, for example, laboratory or imaging tests, as such tests are typically not performed by physical therapists. Tests typically performed by physical therapists include physical examination (e.g. Lachman's test), questionnaires (e.g. the Osteoporosis Risk Assessment Instrument), and health technologies (e.g. spirometry). Studies were included in the review only if they investigated patients and pathologies typically seen by physical therapists in clinical practice. An additional criterion for inclusion was that studies had to be related to musculoskeletal, sports or orthopaedic physical therapy.18 Papers in languages other than English were excluded.
Quality assessment toolsThe QUADAS and DAQS tools comprise 14 and 21 items respectively. Items consist of questions to be scored as “Yes”, “No” or “Unclear”. Questions relate to patient sampling; reference standard and index test description, application and interpretation; reference standard quality; timing of tests; and reporting of the flow of subjects through the study. Additionally, DAQS asks more specific questions on sampling, description of study site and assessors, and statistical reporting. DAQS is intended to produce a quality score whereas QUADAS and QUADAS-2 are not. QUADAS-2 comprises four sections: patient selection; index test; reference standard; and flow and timing. Each section rates the study's risk of bias, and each of the first three sections rates study applicability. Ratings are either “Low”, “High” or “Unclear”. Signaling questions help guide the rater if needed.
Reviewer consensusTwo physical therapy researchers with clinical experience in musculoskeletal, sports and orthopaedic primary care each independently reviewed the 50 studies (Supplemental material) using all three quality rating tools. One researcher (MK) had 22 years of clinical experience, a Masters qualification, and had previously systematically reviewed diagnostic test accuracy studies related to physical therapy. The other researcher (AG) had 6 years of clinical experience, a doctoral qualification, and 4 years of experience researching musculoskeletal disorders. Both reviewers undertook approximately 20h of self-directed learning. This comprised reading through background documents describing each tool6,9,12,19; reviewing past papers that had used these tools; and studying the tools themselves. Prior to data extraction, both reviewers independently piloted the three quality rating tools on three studies similar to the studies in the review9 and then compared results and discussed the interpretation of different criteria.20
For the purpose of this study and to enable comparison between tools, we limited the analysis to one index test from each study.9,19 The reviewers conferred to select the index test.
Use of QUADAS-2 requires that the review question be nominated. It was agreed prior to data extraction that for each study the common review question would be “How accurate are diagnostic tests that physical therapists conduct in musculoskeletal physical therapy primary care?”. We chose to retain all QUADAS-2 signaling questions as it was considered that they all applied to this review.9
Data extraction processEach reviewer independently rated the 50 studies in random order. The quality assessment tools were also applied in a random sequence. Ratings for each item of each tool were collected for each study, as well as ratings for each signaling question in QUADAS-2. If more than one reference standard was used, raters independently nominated the main reference standard for each study and rated the study accordingly.
Data analysisData were analyzed using Stata v14.2.
Summary scoresOf the three tools, DAQS is the only tool that generates a summary score.12 Both QUADAS and QUADAS-2 were intentionally designed to not produce a summary score of study quality.6,9 We were, nonetheless, interested in the properties of summary scores, so we calculated summary scores using an adaptation of the scoring scheme used by Whiting and colleagues21 which weighted all items equally: (1) “No”=0, “Unclear”=1, “Yes”=2 (for QUADAS and DAQS items); (2) “High”=0, “Unclear”=1, “Low”=2 (for QUADAS-2 “Risk of bias” and “Concerns regarding applicability” judgments).
Reliability and measurement errorOur primary interest was in the inter-tester reliability of the individual tool items. Kappa was calculated for individual questions with categorical outcomes.22 Kappa was interpreted as <0.00 poor; 0.00–0.20 slight; 0.21–0.40 fair; 0.41–0.60 moderate; 0.61–0.80 substantial; and 0.81–1.00 almost perfect.23 Percentage agreement for individual questions and average percentage agreement for each tool's full set of questions was also calculated.20 A two-way random effects, absolute agreement, single rater/measurement intraclass correlation model (ICC2,1) was used to measure consistency or homogeneity of summary scores for each tool.24 ICC was interpreted as: <0.40 poor; 0.40–0.75 moderate; and >0.75 excellent.25
Both the standard error of measurement (SEM) and the smallest detectable change (SDC) were used to describe between-rater error of the summary scores for each tool.17,26
Internal consistencyInternal consistency was assessed using Cronbach's alpha,27 calculated separately for each rater for each tool. We considered the rating had acceptable internal consistency when Cronbach's alpha was between 0.70 and 0.95.17,27
Convergent validityConvergent validity was assessed for each rater by comparing the correlations between the summary scores of the three tools. A Pearson's correlation coefficient >0.70 is considered acceptable convergent validity.28
Floor and ceiling effectsFloor or ceiling effects were considered to be present if >15% of studies achieved the lowest or highest possible score, respectively.17 This was calculated separately for each rater for each tool.
ResultsOf the 50 randomly selected studies, 46 (92%) were relevant to musculoskeletal physical therapy, 22 (44%) were relevant to orthopaedics, and 2 (4%) were relevant to sports. Often a single study was classified in several ways. Thus some papers were also relevant to paediatrics (8%), continence and women's health (6%), and gerontology (2%). All papers were published between 1984 and 2015.
Main reference standardIn 8 of the 50 papers (16%), the 2 raters independently selected different reference standards for the study.
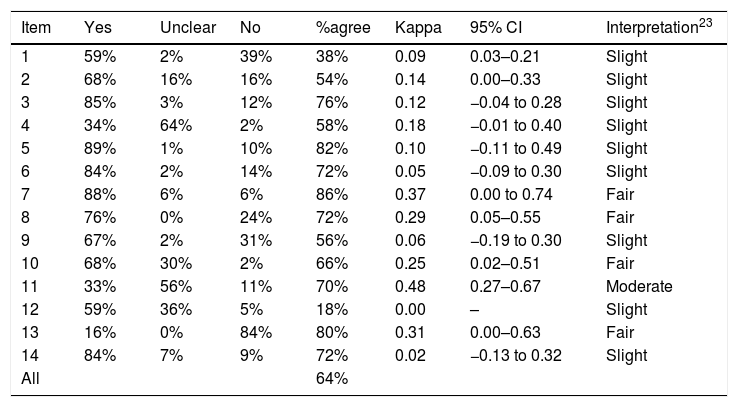
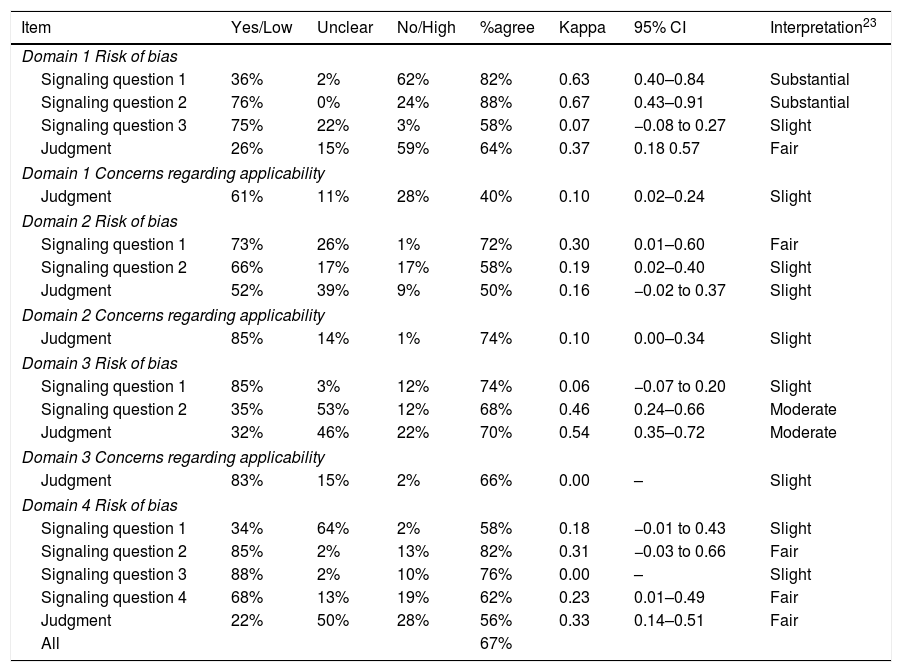
Reliability and measurement errorTables 2–4 show reliability of the three tools. Kappa scores were ≤0.40 (below moderate reliability) for 13 of 14 (93%) QUADAS items and 14 of 21 (67%) DAQS items. For QUADAS-2, kappa was ≤0.40 for 6 of the 7 (86%) judgment items, or for 14 of 18 (78%) items if signaling questions were included.
Between-reviewer reliability for each item of QUADAS.
| Item | Yes | Unclear | No | %agree | Kappa | 95% CI | Interpretation23 |
|---|---|---|---|---|---|---|---|
| 1 | 59% | 2% | 39% | 38% | 0.09 | 0.03–0.21 | Slight |
| 2 | 68% | 16% | 16% | 54% | 0.14 | 0.00–0.33 | Slight |
| 3 | 85% | 3% | 12% | 76% | 0.12 | −0.04 to 0.28 | Slight |
| 4 | 34% | 64% | 2% | 58% | 0.18 | −0.01 to 0.40 | Slight |
| 5 | 89% | 1% | 10% | 82% | 0.10 | −0.11 to 0.49 | Slight |
| 6 | 84% | 2% | 14% | 72% | 0.05 | −0.09 to 0.30 | Slight |
| 7 | 88% | 6% | 6% | 86% | 0.37 | 0.00 to 0.74 | Fair |
| 8 | 76% | 0% | 24% | 72% | 0.29 | 0.05–0.55 | Fair |
| 9 | 67% | 2% | 31% | 56% | 0.06 | −0.19 to 0.30 | Slight |
| 10 | 68% | 30% | 2% | 66% | 0.25 | 0.02–0.51 | Fair |
| 11 | 33% | 56% | 11% | 70% | 0.48 | 0.27–0.67 | Moderate |
| 12 | 59% | 36% | 5% | 18% | 0.00 | – | Slight |
| 13 | 16% | 0% | 84% | 80% | 0.31 | 0.00–0.63 | Fair |
| 14 | 84% | 7% | 9% | 72% | 0.02 | −0.13 to 0.32 | Slight |
| All | 64% |
Abbreviation: %agree, percentage agreement.
Between-reviewer reliability for each item of QUADAS-2.
| Item | Yes/Low | Unclear | No/High | %agree | Kappa | 95% CI | Interpretation23 |
|---|---|---|---|---|---|---|---|
| Domain 1 Risk of bias | |||||||
| Signaling question 1 | 36% | 2% | 62% | 82% | 0.63 | 0.40–0.84 | Substantial |
| Signaling question 2 | 76% | 0% | 24% | 88% | 0.67 | 0.43–0.91 | Substantial |
| Signaling question 3 | 75% | 22% | 3% | 58% | 0.07 | −0.08 to 0.27 | Slight |
| Judgment | 26% | 15% | 59% | 64% | 0.37 | 0.18 0.57 | Fair |
| Domain 1 Concerns regarding applicability | |||||||
| Judgment | 61% | 11% | 28% | 40% | 0.10 | 0.02–0.24 | Slight |
| Domain 2 Risk of bias | |||||||
| Signaling question 1 | 73% | 26% | 1% | 72% | 0.30 | 0.01–0.60 | Fair |
| Signaling question 2 | 66% | 17% | 17% | 58% | 0.19 | 0.02–0.40 | Slight |
| Judgment | 52% | 39% | 9% | 50% | 0.16 | −0.02 to 0.37 | Slight |
| Domain 2 Concerns regarding applicability | |||||||
| Judgment | 85% | 14% | 1% | 74% | 0.10 | 0.00–0.34 | Slight |
| Domain 3 Risk of bias | |||||||
| Signaling question 1 | 85% | 3% | 12% | 74% | 0.06 | −0.07 to 0.20 | Slight |
| Signaling question 2 | 35% | 53% | 12% | 68% | 0.46 | 0.24–0.66 | Moderate |
| Judgment | 32% | 46% | 22% | 70% | 0.54 | 0.35–0.72 | Moderate |
| Domain 3 Concerns regarding applicability | |||||||
| Judgment | 83% | 15% | 2% | 66% | 0.00 | – | Slight |
| Domain 4 Risk of bias | |||||||
| Signaling question 1 | 34% | 64% | 2% | 58% | 0.18 | −0.01 to 0.43 | Slight |
| Signaling question 2 | 85% | 2% | 13% | 82% | 0.31 | −0.03 to 0.66 | Fair |
| Signaling question 3 | 88% | 2% | 10% | 76% | 0.00 | – | Slight |
| Signaling question 4 | 68% | 13% | 19% | 62% | 0.23 | 0.01–0.49 | Fair |
| Judgment | 22% | 50% | 28% | 56% | 0.33 | 0.14–0.51 | Fair |
| All | 67% | ||||||
Abbreviation: %agree, percentage agreement.
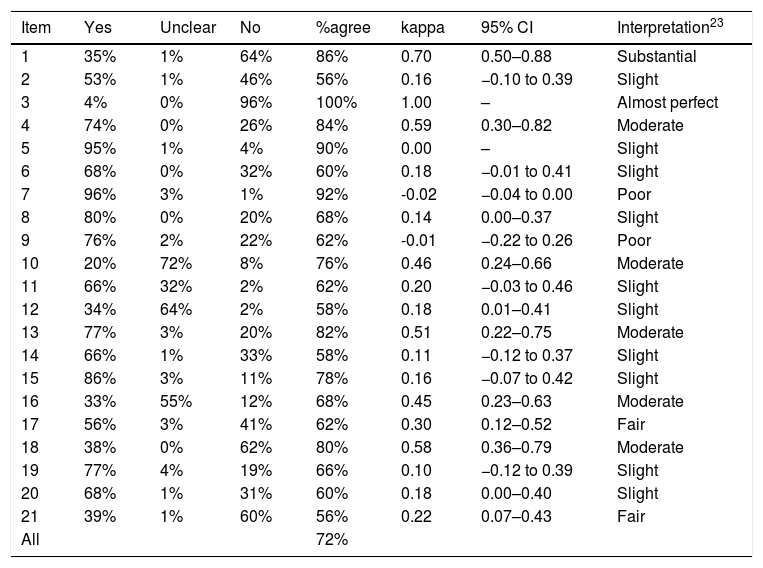
Between-reviewer reliability for each item of DAQS.
| Item | Yes | Unclear | No | %agree | kappa | 95% CI | Interpretation23 |
|---|---|---|---|---|---|---|---|
| 1 | 35% | 1% | 64% | 86% | 0.70 | 0.50–0.88 | Substantial |
| 2 | 53% | 1% | 46% | 56% | 0.16 | −0.10 to 0.39 | Slight |
| 3 | 4% | 0% | 96% | 100% | 1.00 | – | Almost perfect |
| 4 | 74% | 0% | 26% | 84% | 0.59 | 0.30–0.82 | Moderate |
| 5 | 95% | 1% | 4% | 90% | 0.00 | – | Slight |
| 6 | 68% | 0% | 32% | 60% | 0.18 | −0.01 to 0.41 | Slight |
| 7 | 96% | 3% | 1% | 92% | -0.02 | −0.04 to 0.00 | Poor |
| 8 | 80% | 0% | 20% | 68% | 0.14 | 0.00–0.37 | Slight |
| 9 | 76% | 2% | 22% | 62% | -0.01 | −0.22 to 0.26 | Poor |
| 10 | 20% | 72% | 8% | 76% | 0.46 | 0.24–0.66 | Moderate |
| 11 | 66% | 32% | 2% | 62% | 0.20 | −0.03 to 0.46 | Slight |
| 12 | 34% | 64% | 2% | 58% | 0.18 | 0.01–0.41 | Slight |
| 13 | 77% | 3% | 20% | 82% | 0.51 | 0.22–0.75 | Moderate |
| 14 | 66% | 1% | 33% | 58% | 0.11 | −0.12 to 0.37 | Slight |
| 15 | 86% | 3% | 11% | 78% | 0.16 | −0.07 to 0.42 | Slight |
| 16 | 33% | 55% | 12% | 68% | 0.45 | 0.23–0.63 | Moderate |
| 17 | 56% | 3% | 41% | 62% | 0.30 | 0.12–0.52 | Fair |
| 18 | 38% | 0% | 62% | 80% | 0.58 | 0.36–0.79 | Moderate |
| 19 | 77% | 4% | 19% | 66% | 0.10 | −0.12 to 0.39 | Slight |
| 20 | 68% | 1% | 31% | 60% | 0.18 | 0.00–0.40 | Slight |
| 21 | 39% | 1% | 60% | 56% | 0.22 | 0.07–0.43 | Fair |
| All | 72% |
Abbreviation: %agree, percentage agreement.
Of the 12 items across all tools with kappa >0.40 (interpreted as moderate reliability or above), 5 related to the reference standard (QUADAS item #11; QUADAS-2 Domain 3 Risk of bias Signaling question 2 and Risk of bias Judgment; DAQS items #13 and #16); 5 related to patient sampling or enrolment (QUADAS-2 Domain 1 Risk of bias Signaling questions 1 and 2; DAQS items #1, #3 and #4); and 2 related to statistical reporting (DAQS items #10 and #18). Of the 7 items across all the tools asking raters about the clarity or extent of descriptions (“clearly described”, “sufficiently described”, “adequately described”), kappa values ranged from −0.01 to 0.22, all below a moderate rating. Two questions (QUADAS item #14 and DAQS item #19) that could have been accurately answered as “not applicable” in several studies both had kappa ≤0.10.
All QUADAS-2 “Concerns regarding applicability” judgments had kappa values ≤0.10 and were rated as slight. QUADAS items #1 and #2, which relate to variability and could affect generalizability,6 had kappa values of 0.09 and 0.14 respectively, and were rated as slight.
The average agreement between the two raters was 64% for QUADAS, 67% for QUADAS-2, and 72% for DAQS.
The inter-tester reliability of the QUADAS summary scores was poor (ICC2,1=0.27; 95% CI −0.02 to 0.52) as was the inter-tester reliability of the QUADAS-2 summary scores (ICC2,1=0.36; 95% CI 0.08–0.59). Inter-tester reliability of the DAQS summary score was moderate (ICC2,1=0.45; 95% CI 0.15–0.66). The 0–28 point QUADAS tool had an SEM of 2.7 points; the 0–14 point QUADAS-2 tool had an SEM of 1.8 points; and the 0–42 point DAQS tool had an SEM of 3.6 points. The SDC was 7.4 points for QUADAS, 4.9 points for QUADAS-2 and 9.9 points for DAQS.
Internal consistencyThe internal consistency of QUADAS was less than acceptable for both Rater 1 (α=0.60; item #12 was constant in the sample so was dropped from the analysis) and Rater 2 (α=0.45).27 QUADAS-2 internal consistency was acceptable for Rater 1 (α=0.70; Domain 3 Concerns regarding applicability judgment was constant in the sample so was dropped from the analysis) and Rater 2 (α=0.76; Domain 4 Risk of bias Signaling question 3 was constant in the sample so was dropped from the analysis) while it was rated as less than acceptable for both raters of DAQS (Rater 1: α=0.58; item #5 was constant in the sample so was dropped from the analysis; Rater 2: α=0.61).
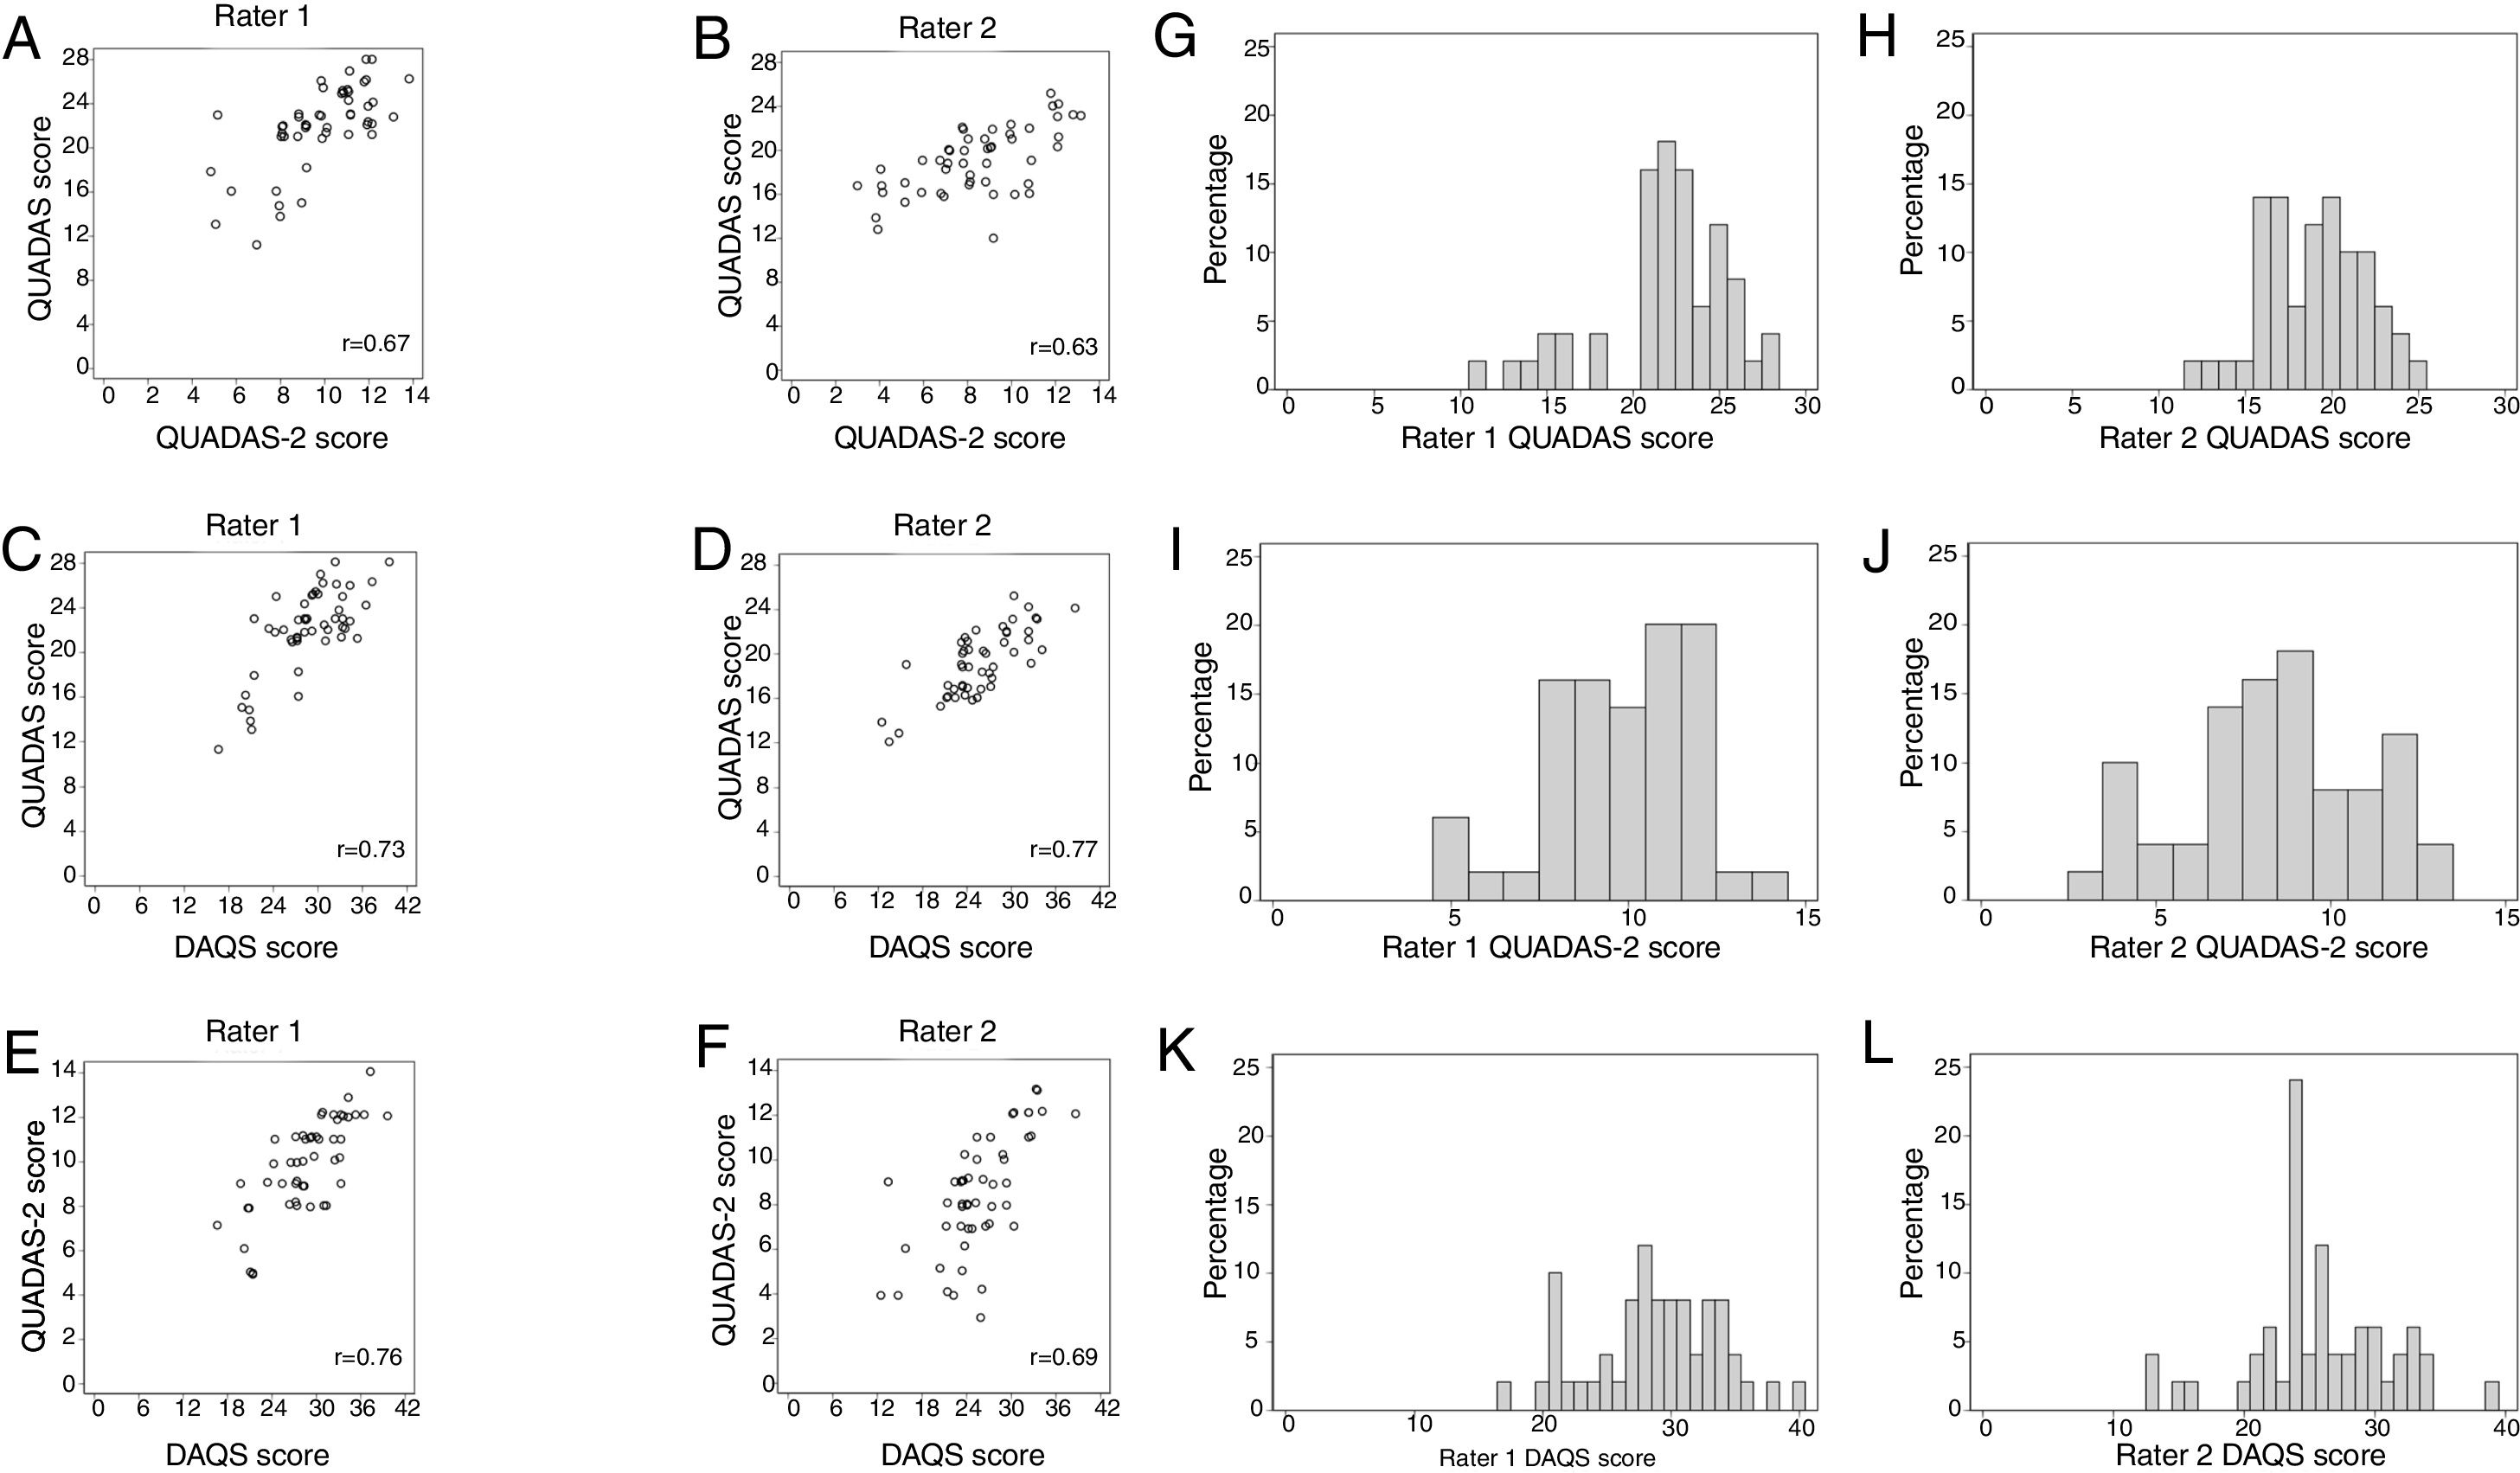
Convergent validityFig. 1 shows the relationships between each rater's summary scores. Correlations ranged from 0.63 to 0.77. Acceptable convergent validity was found for 3/6 of the pairs of rating tools: r=0.73 for QUADAS vs DAQS (Rater 1); r=0.77 for QUADAS vs DAQS (Rater 2); and r=0.76 for QUADAS-2 vs DAQS (Rater 1).
Floor and ceiling effects and score frequencies for each rating tool as a percentage of the total for each rater (G–L).")
Fig. 1 shows the score frequencies for each tool for each rater. Neither floor nor ceiling effects were present in any rating tools.
Study qualityMean summary scores (and percentages) of a possible score of 28 for QUADAS were 21.9 (78%) for Rater 1 and 19.0 (68%) for Rater 2; of a possible score of 14 for QUADAS-2 were 9.8 (70%) for Rater 1 and 8.4 (60%) for Rater 2; and of a possible score of 42 for DAQS were 28.8 (69%) for Rater 1 and 25.8 (61%) for Rater 2. Tables 2–4 describe the total percentage of ratings for each item of each tool but we specifically report on the typical quality of the sample of studies by considering only items that had at least moderate kappa reliability (kappa>0.40). Interpretation of reference standard results without knowledge of index test results was rated as “Unclear” in 56% (QUADAS item #11), 55% (DAQS item #16) and 53% (QUADAS-2 Domain 3 Risk of bias Signaling question 2) of studies. The enrolment of a consecutive or random sample of patients was rated as “No” in 64% (DAQS item #1) and 62% (QUADAS-2 Domain 1 Risk of bias Signaling question 1) of studies. The avoidance of a case–control sampling strategy was rated as “Yes” in 76% (QUADAS-2 Domain 1 Risk of bias Signaling question 2) and 74% (DAQS item #4) of studies.
Other reliable items from the DAQS tool showed 77% of the studies were rated “Yes” for having all patients tested with the same reference standard (DAQS item #13) and 72% of studies were rated “Unclear” as to whether the index test demonstrated sufficient reliability (DAQS item #10). Inclusion of an adequate sample size derived from a power analysis (DAQS item #3) was rated as “No” in 96% of studies. In 62% of studies, the provision of confidence intervals of the diagnostic accuracy values (DAQS item #18) was rated as “No”.
DiscussionStatement of principal findingsTo our knowledge, this is the first study to conduct a head-to-head comparison of measurement properties of QUADAS, QUADAS-2 and DAQS. The study shows that inter-tester reliability of individual tool items is poor. The least reliable items asked raters about the clarity or extent of descriptions, could often be accurately answered as “not applicable”, or related to the generalizability of study results. Inter-tester reliability of the tools’ summary scores is moderate or poor. The large SEM for all the tools implies poor reliability and precision of summary scores. Although floor or ceiling effects were not present in any tool, at least half of the measures of internal consistency and convergent validity did not reach an acceptable level.
The quality of the sample of rated studies was mixed. Most studies avoided case–control designs which overestimate diagnostic test performance,29 but more than half the studies did not enroll consecutive or random samples. Over three-quarters of studies tested all subjects with the same reference standard, although it was unclear in about half of all studies whether the reference standard was interpreted without knowledge of the results of the index test. More than half the studies did not provide confidence intervals about estimates of diagnostic test accuracy.
Strengths and weaknesses of the studyA strength of this study is that we conducted head-to-head comparisons of multiple measurement properties of the three scales. To our knowledge, most of these measurement properties of the three scales have not been examined before. This study also gives us an insight into the typical methodological quality of diagnostic test accuracy studies related to physical therapy.
This study included an adequate number of primary diagnostic test accuracy studies.17 The studies were relevant to the discipline of physical therapy rather than just a specific pathology or population. The sample was randomly selected from a database thought to include most studies of the accuracy of diagnostic tests relevant to physical therapy. Only studies from three subdisciplines of physical therapy (musculoskeletal, sports and orthopaedics) were included in this study to accommodate the raters’ clinical experience.6 While this might restrict the generalizability of the findings, a recent study (manuscript under review)3 found that these three subdisciplines provide 83% of diagnostic test accuracy studies related to physical therapy. These results therefore allow us to infer how these tools may perform across a variety of subdisciplines within physical therapy.
Another strength of the study is that raters undertook ∼20h of self-directed learning to understand how to use the tools, piloted them on trial papers, and discussed interpretations before rating the papers to improve consensus.
A possible study limitation is that the analysis of total scores for QUADAS and QUADAS-2 may be considered inappropriate by some readers. The authors of the QUADAS and QUADAS-2 tools did not intend to calculate total scores.6,9 However, our belief is that even if users of QUADAS and QUADAS-2 do not formally calculate total scores they use informal impressions of the total scores to guide impressions of quality. Moreover, comparison of various measurement properties between the three rating scales required summary scores. Consequently, in this study, we used a scoring scheme previously used by one of the authors of the QUADAS and QUADAS-2 tools.21
Another limitation of this study was the inclusion only of studies written in English. Only 9% of diagnostic test accuracy studies relevant to physical therapy are reported in languages other than English.3 As this proportion is small it is unlikely to cause serious bias.
In 8 of 50 studies there was more than one reference standard and the raters did not agree on the main reference standard. As 51% of items in the three tools related to the reference standard (8 of 14 QUADAS items; 11 of 18 QUADAS-2 items; 8 of 21 DAQS items; 27 of 53 in total), this may have adversely affected reliability estimated in this study. A sensitivity analysis was therefore performed on the 42 studies for which there was reference standard consensus. That analysis yielded very similar findings to those reported above.
Unanswered questions and future researchThis study has shown that the most widely used tools to rate diagnostic test accuracy studies in physical therapy are not reliable. The implication would appear to be that these tools should not be trusted to provide robust evidence of quality. The design of a tool that could reliably quantify study quality would be an important next step in assessing the evidence available for diagnostic tests relevant to physical therapy. Such a tool could incorporate the more reliable elements of the existing tools.
QUADAS items #1 and #2 are described by the original authors as relating to variability which may affect study result generalizability.6 QUADAS-2 authors created separate “Concerns regarding applicability” parts of the tool for each domain to help judge potential sources of variation,9 equating applicability with external validity30 or generalizability.31 In our study, items that related to the generalizability of study results had poor reliability. Moreover, as Schueler et al.31 argue, it is likely reviewers typically filter for applicable studies using eligibility criteria. To the extent that this is true, assessment of applicability is unnecessary. Clinicians who read diagnostic test accuracy studies are well placed to judge the generalizability of each study's results to their own practice.
Consequently, we recommend any new quality assessment tool should exclude items relating to generalizability of study results; reword items asking about clarity or extent of descriptions; reword items that could be rated as “not applicable” to only allow for available codes; and give clear instructions on how to deal with studies involving multiple index tests, reference standards or pathologies.
Accurate assessment of the methodological quality of diagnostic accuracy studies is difficult if reporting is inadequate.32 Whiting and colleagues6 note assessment of study quality is closely related to assessment of reporting quality. The Standards for Reporting of Diagnostic Accuracy (STARD) initiative aims to improve the reporting of diagnostic test accuracy studies so that potential for bias can be more easily evaluated.33,34
ConclusionsQUADAS, QUADAS-2 and DAQS are unreliable measures of the quality of diagnostic test accuracy studies in physical therapy. Moreover, to the extent of being able to accurately measure it, the quality of this type of study is typically mixed across various domains such as sampling methods, reference standard application and interpretation, and reporting of accuracy results.
FundingThis research did not receive any specific grant from funding agencies in the public, commercial, or not-for-profit sectors.
Conflicts of interestThe authors declare no conflicts of interest.
The following is the supplementary data to this article:


