
Heart rate variability is used as an assessment method for cardiac autonomic modulation. Since the Task Force's publication on heart rate variability in 1996, the European Heart Rhythm Association Position Paper in 2015 and a recent publication in 2017, attention has been paid to recommendations on using heart rate variability analysis methods, as well as their applications in different physiological conditions and clinical studies. This analysis has proved to be useful as a complementary tool for clinical evaluation and to assess the effect of non-pharmacological therapeutic interventions, such as physical exercise programmes, on cardiac autonomic modulation.
ObjectiveThe aim of this article is to make recommendations and to develop a checklist of normalisation procedures regarding the use of heart rate variability data collection and analysis methodology, focusing on the cardiology area and cardiac rehabilitation.
MethodsBased on previous heart rate variability publications, this paper provides a description of the most common shortcomings of using the analysis methods and considers recommendations and suggestions on how to minimise these occurrences by using a specific checklist.
ConclusionsThis article includes recommendations and a checklist regarding the use of heart rate variability collection and analysis methods. This work could help improve reporting on clinical evaluation and therapeutic intervention results and consequently, disseminate heart rate variability knowledge.
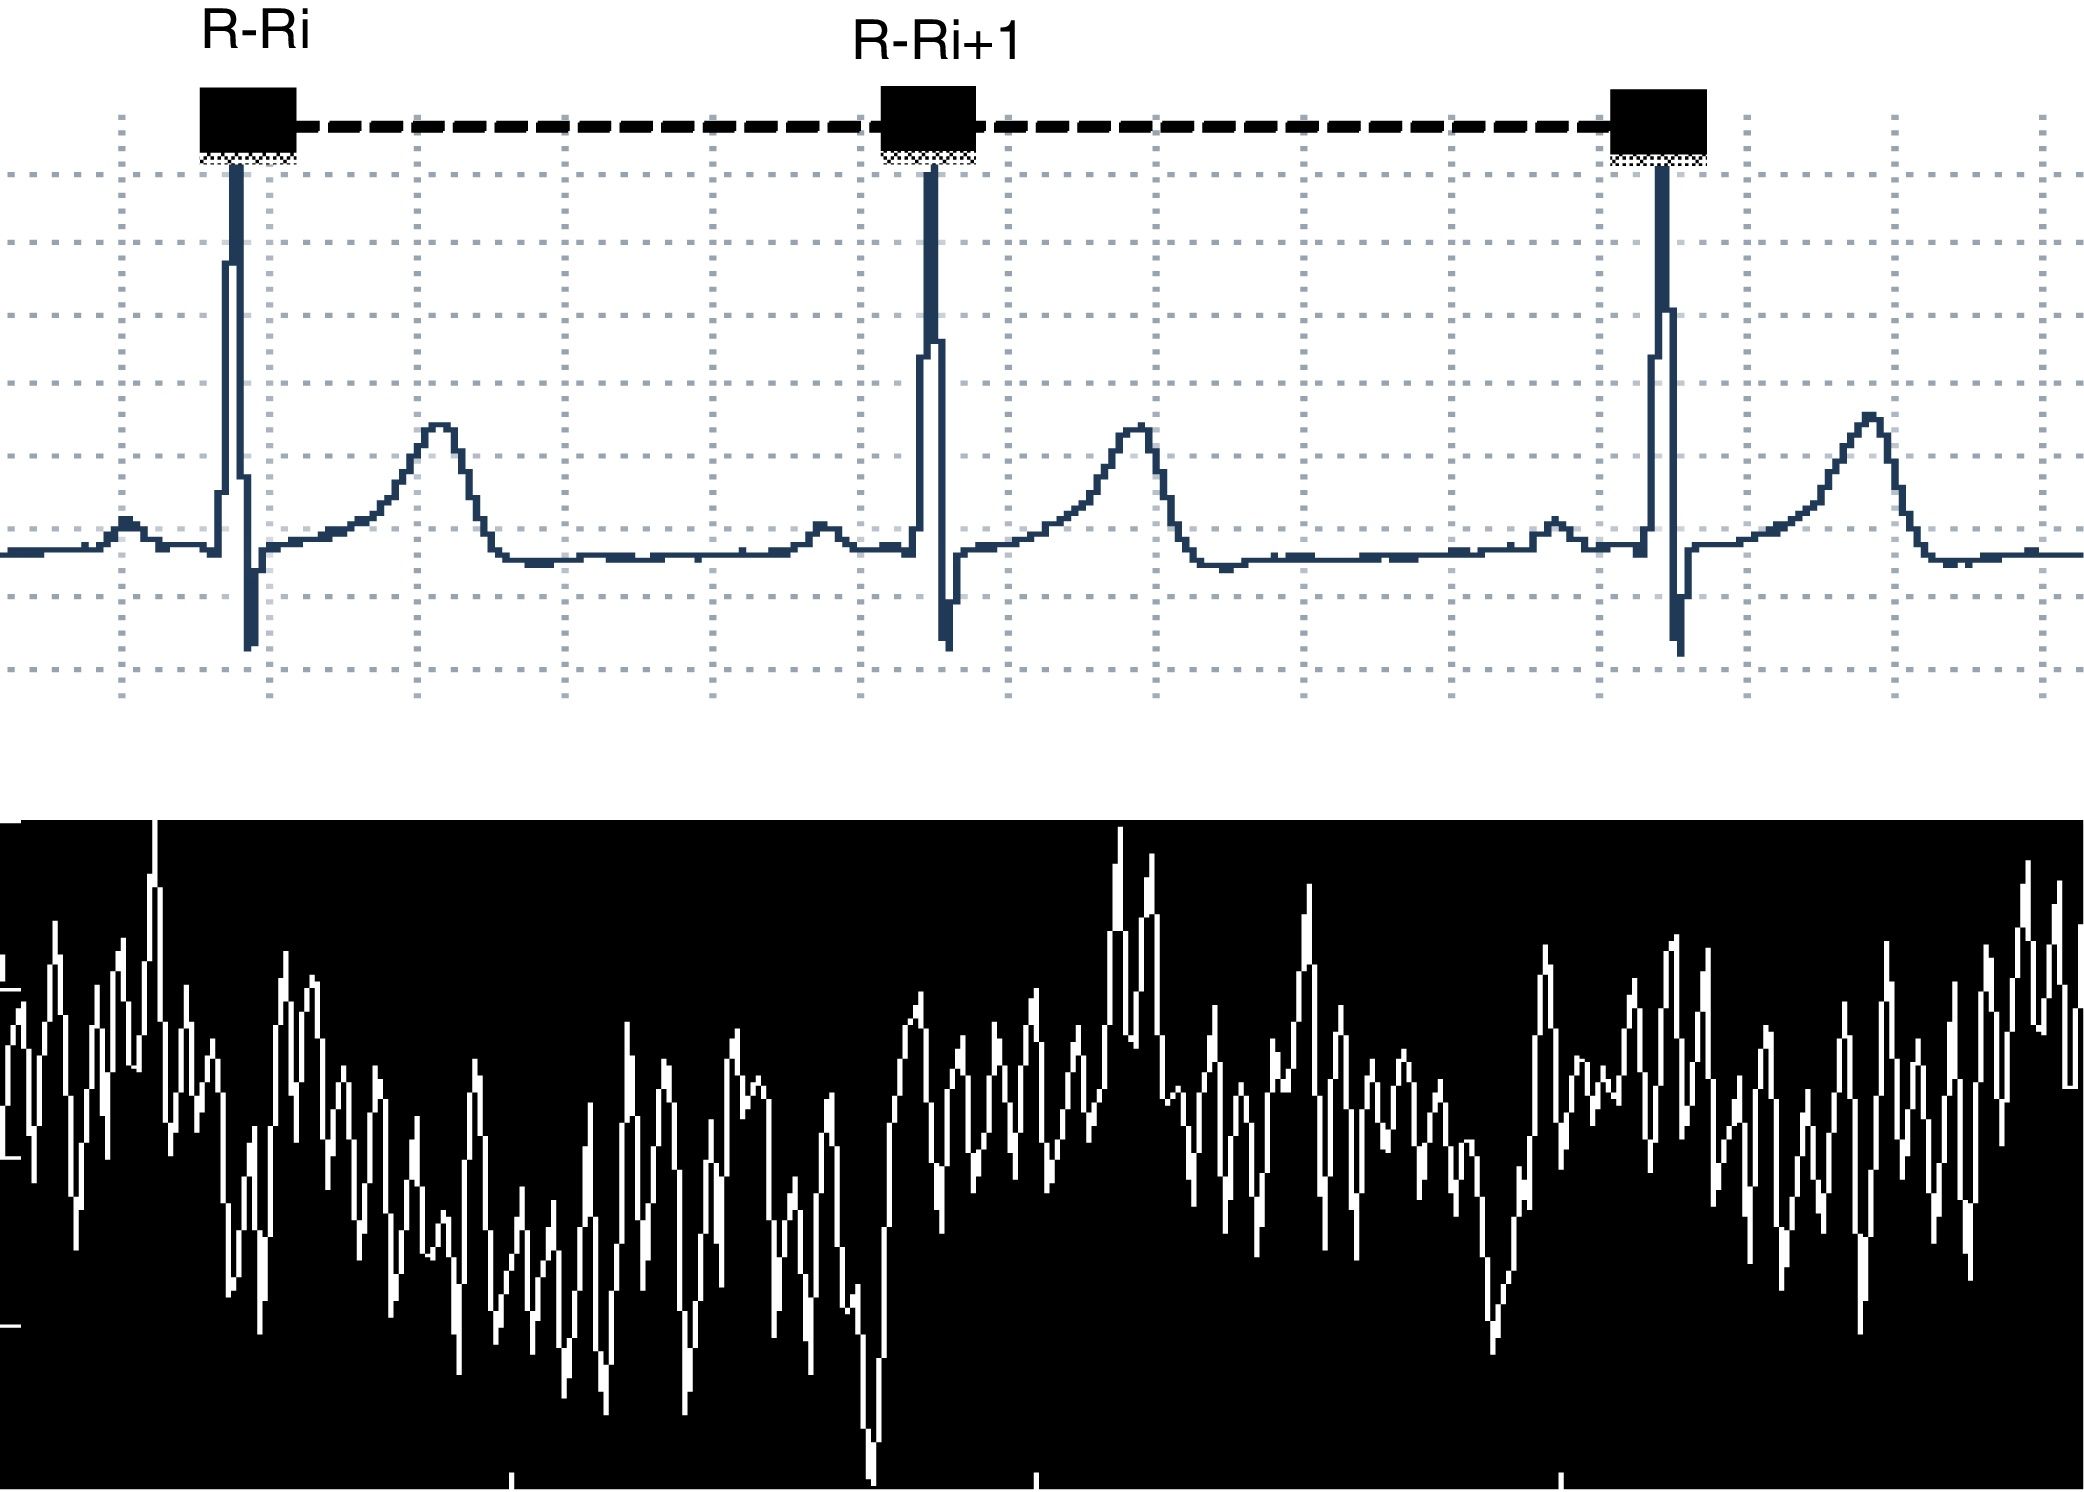
Heart rate variability (HRV), a non-invasive method used to evaluate the autonomic nervous system modulation on the cardiac sinus node,1–4 describes the oscillations between consecutive electrocardiogram R-R intervals (R-Ri), Fig. 1.
 in milliseconds (upper) and a tachogram formed from a time series of collected R-Ri (lower).")
Currently, there is growing interest in understanding the mechanisms involved with HRV, its clinical utility as well as changes in its standards that may indicate health impairment. High levels of HRV indices are generally signs of efficient autonomic mechanisms that characterise a healthy individual, while low or reduced HRV often show an autonomic nervous system malfunction and may imply health impairment.3
However, there are cardiac abnormalities such as conduction disorders and atrial fibrillation (particularly present in the elderly) that can also produce high HRV. In this condition, it is strongly linked to increased risk of mortality. Therefore, prior to collecting HRV, a clinical evaluation of the subjects is necessary accompanied by an electrocardiogram and a careful interpretation of it.1
HRV is an attractive option and a promising clinical tool to evaluate and identify health impairment due to its wide range of uses, the fact that it is cost-effective to adopt the technique and it is easy to acquire data.
Various studies in the cardiology area have shown the importance of this method as a tool to assess patients after cardiac surgery,5–8 after myocardial infarction,9,10 patients with ventricular dysfunction,11 arrhythmias,12 to predict cardiac sudden death13,14 and to evaluate patients who received physical exercise therapeutic intervention.15–17
Special importance has also been given to the evaluation of HRV as a predictor of cardiovascular disease risk.18 Low values of HRV indexes have shown to be a strong predictor of a low probability of survival in patients with left ventricular dysfunction or heart failure, or with prior myocardial infarction,9,19 or bypass surgeries.6,20
Considering that the dissemination of the findings of these and other studies that use HRV as a method of analysis is crucial for healthcare development and that many results are clinically important, it is essential to use this method properly.1,4
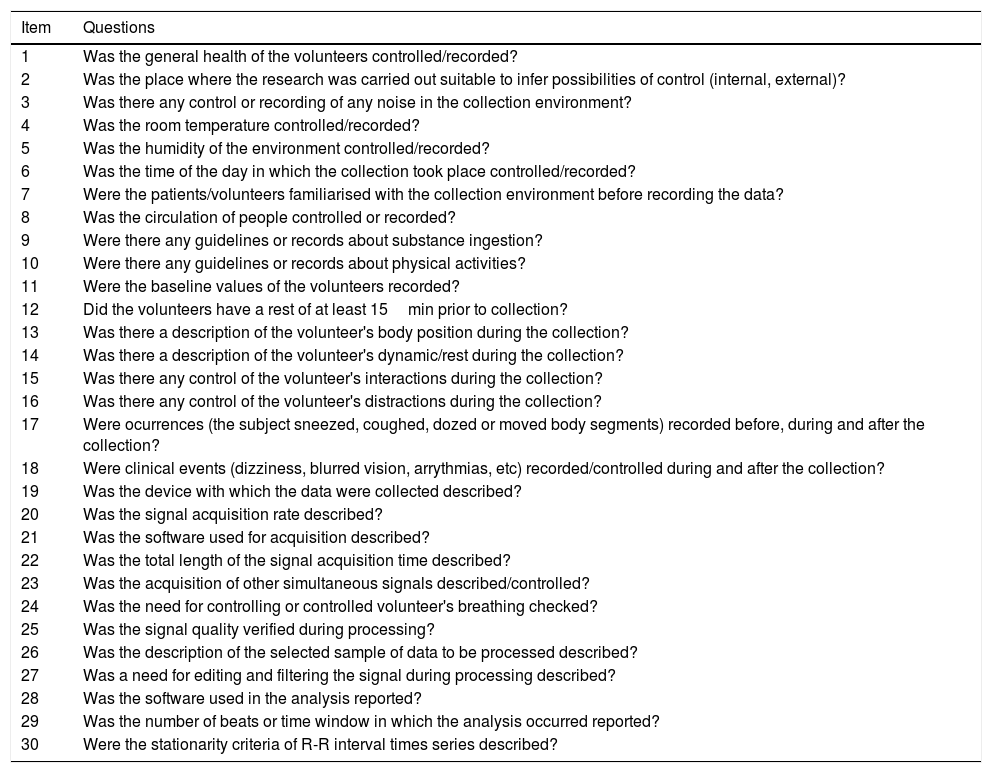
However, in order to obtain reliable and reproducible results in the HRV analysis, equipment, methods and techniques should be used ranging from preparing the collection site, using tools to capture and determine R-Ri time series to analysing them. Depending on the way in which a method is used, it may reveal shortcomings. In this article, based on previous HRV publications,1,2,4,21 we intend to point out the shortcomings that most commonly stem from using the HRV methodology and to present some recommendations on how to minimise these occurrences by using a specific checklist (Table 1) for this purpose.
Checklist of procedures to follow for capturing and processing heart rate variability.
| Item | Questions |
|---|---|
| 1 | Was the general health of the volunteers controlled/recorded? |
| 2 | Was the place where the research was carried out suitable to infer possibilities of control (internal, external)? |
| 3 | Was there any control or recording of any noise in the collection environment? |
| 4 | Was the room temperature controlled/recorded? |
| 5 | Was the humidity of the environment controlled/recorded? |
| 6 | Was the time of the day in which the collection took place controlled/recorded? |
| 7 | Were the patients/volunteers familiarised with the collection environment before recording the data? |
| 8 | Was the circulation of people controlled or recorded? |
| 9 | Were there any guidelines or records about substance ingestion? |
| 10 | Were there any guidelines or records about physical activities? |
| 11 | Were the baseline values of the volunteers recorded? |
| 12 | Did the volunteers have a rest of at least 15min prior to collection? |
| 13 | Was there a description of the volunteer's body position during the collection? |
| 14 | Was there a description of the volunteer's dynamic/rest during the collection? |
| 15 | Was there any control of the volunteer's interactions during the collection? |
| 16 | Was there any control of the volunteer's distractions during the collection? |
| 17 | Were ocurrences (the subject sneezed, coughed, dozed or moved body segments) recorded before, during and after the collection? |
| 18 | Were clinical events (dizziness, blurred vision, arrythmias, etc) recorded/controlled during and after the collection? |
| 19 | Was the device with which the data were collected described? |
| 20 | Was the signal acquisition rate described? |
| 21 | Was the software used for acquisition described? |
| 22 | Was the total length of the signal acquisition time described? |
| 23 | Was the acquisition of other simultaneous signals described/controlled? |
| 24 | Was the need for controlling or controlled volunteer's breathing checked? |
| 25 | Was the signal quality verified during processing? |
| 26 | Was the description of the selected sample of data to be processed described? |
| 27 | Was a need for editing and filtering the signal during processing described? |
| 28 | Was the software used in the analysis reported? |
| 29 | Was the number of beats or time window in which the analysis occurred reported? |
| 30 | Were the stationarity criteria of R-R interval times series described? |
- 1.
Not fully reporting the clinical characteristics of the sample;
- 2.
Not characterising properly what is considered “normal,” “general population”, “healthy,” and “apparently healthy”;
- 3.
Not accurately reporting demographic data such as body mass, height and body mass index;
- 4.
Not reporting age range and gender studied/assessed.
HRV can be influenced by different factors (age, gender, ethnicity, physical fitness, health status, body composition, use of alcohol, tobacco, illicit drugs and medicine in regular use),1,4,22,23 as well as physiological conditions (circadian rhythms, the sleep cycle, core body temperature, metabolism)1,24 environment (noise, temperature, humidity and the time of the day)21; contextual factors (recording method; sampling frequency; recording period length; removal of artefacts)1,4; influences of body position,25 breathing mechanics and movement,26 recent physical activity1,27; emotion-cognition interactions, psychosocial stress28 and pathological conditions such as chronic diseases, among them cardiovascular diseases,4 as discussed throughout this paper. Thus, it is important to clinically characterise the individuals that will make up the sample to be evaluated/studied.
Prior to collecting the HRV, it is suggested that the individual's medical history is accurately identified focusing on: (a) clinical data: to verify if there is a known diagnosis and how long ago the disease was identified; data analysis concerning previous medical tests (laboratory tests, electrocardiogram, ergometric tests or ergospirometry, echocardiogram, holter, etc.); listing medications (dosage and how long the patient has been taking the medicine); asking questions to identify if there are comorbidities; checking for a clinical complaint, identifying history of symptoms; (b) checking if there have been recent illnesses, hospitalisation or any surgeries: identifying the period and procedures used; (c) investigating aerobic functional capacity; current and past life habits; (d) identifying stress levels (at work and personal life); (e) investigating family history (cardiovascular, pulmonary, metabolic diseases, etc...).
Various investigations have classified individuals as “apparently healthy” based on the evaluations carried out in the study, for example, absence of history and clinical evidence of diseases based on medical history, physical examinations, laboratory tests (biochemical blood tests), conventional electrocardiograms at rest, cardiopulmonary exercise tests and not taking any medication that interferes with cardiovascular control.29
In addition, the characterisation of demographic data such as body mass, height, body mass index, age, gender and, when possible, peak oxygen consumption should be described. These aspects, such as age1 may contribute to decreasing aerobic functional capacity29 and HRV,30,31 therefore special attention must be given to properly characterising the subjects to be evaluated.1
In addition, the standardisation of HRV values should also be considered. In a systematic review in which data were collected with short-term records (5min)32 and in a recent study using 24-h HRV data,33 reference values were identified for some HRV indices that differed from the 1996 guidelines.4 In another recent well-designed study, Dantas et al.,23 studied short-term records and resting-state HRV in healthy non-medicated subjects from 35 to 74 years. They provided reference values for some HRV indices by linear analysis. Thus, these new reference values can be considered as a comparison when the same methods and measurements are selected for analysis, jointly with individual clinical characteristics.23,33
Data collection site and volunteer preparationThe procedures for collecting HRV can be carried out in various sites such as: research laboratories, hospital environments, external and occupational work environments, offices and residences, among others. For data collection to take place, various aspects should be considered, such as the data collection environment, including the volunteer's familiarisation with the site, procedures used, equipment, previous preparation of the patient or volunteer, and the actual data collection situation, as discussed below.
Data collection siteMost common shortcomings- 1.
Not reporting if the data collection environment was controlled or not (noise, temperature, humidity and the period of the day);
- 2.
Not familiarising the volunteer with the data collection site, experimental procedure, equipment and staff;
- 3.
During the test, allowing assessors to come and go into the testing environment.
The experiments and/or tests carried out should ideally have the following characteristics: they should be carried out in a quiet environment with minimum circulation of people, especially for short duration measurements; the temperature and relative humidity of the air should be controlled, it is suggested that the temperature be maintained from 20 to 24 degrees and humidity between 40 and 60%23,30; the period of day (morning, afternoon or night) should be standardised within the same research project, considering the possible influences of circadian rhythms.24,34 If it is not possible to control these variables, such as in outdoor collections, all variables should be measured and the data collection conditions reported in the study. Volunteers should be previously familiarised with equipment, staff, as well as the experimental procedure to be followed and the data collection site, where applicable.3,27
Preparing the volunteer/patient beforehand for the data collectionMost common shortcomings- 1.
Failing to advise the volunteer/patient about the stimulant substances and beverages that should be abstained prior to the HRV test/data collection;
- 2.
Failing to draw attention to the importance of not doing extreme physical exercises the day before, and that they should have a good night's sleep, as well as advising them to take medicine (or not) that can potentially change the HRV;
- 3.
On the day of the test, not resting before collection and not controlling basal physiological variables, such as heart rate and blood pressure;
- 4.
On the day of the test, not asking the individual about his/her health condition;
- 5.
Failing to remove mobile devices or other electronic equipment from the vicinity that may interfere with proper data collection.
Before carrying out the HRV collection, the volunteer/patient should receive some guidelines on factors that may influence it. They should be advised not to take any of the following substances the day before the test and on the day of the test: alcohol, caffeine, nicotine, chocolate, soda, energy drinks30 and, whenever possible, medications. For those who use drugs regularly, the name of the medications, the dosages and the amount of time the volunteer/patient has been taking them should be reported in the study.35,36 Still, in the same condition, the volunteer/patient should not have done any strenuous physical exercise and should have had a good night's sleep.1,27 An exception to this is when athletes and physically active individuals are evaluated, since even after doing maximum physical exercise, a return of HRV to the basal conditions can be observed after 120min at the end of the task, depending on the HRV index to be analysed, volume and intensity of the physical stress. For this sample, this response represents a specific characteristic for recovery.37 Thus, for these individuals, the guidelines about a good night's sleep and those on the day of the test should be maintained.
It is important that on the day of the test, prior to data collection, the subjects should be asked about adhering to the researcher's guidelines, sleep conditions, general health conditions, and should take a rest to control the baseline physiological variables.1,27,38
Situation or condition in which the HRV was collectedMost common shortcomings- 1.
Not registering the condition in which the HRV was collected, i.e., rest or exercise, awake or asleep, which posture was adopted (lying down, sitting, orthostatism), etc;
- 2.
Forgetting to ask the individual not to talk or sleep during the data collection;
- 3.
Not making notes if the subject sneezed, coughed, dozed off or moved during the data collection.
Before starting the experiments/tests, the condition in which the HRV was collected should be noted down, i.e.: rest, exercise or after-exercise recovery condition; during active or passive postural change25; during pharmacological block or other stimuli; awake or asleep.21 Furthermore, the individual should be asked not to talk, sleep or move during the collection. The assessor should also note down if the subject sneezed, coughed, dozed off, moved and in which period of time it occurred in the recording. These situations can generate noise in the electrocardiogram (ECG) tracing and change the quality of the collection. Thus, it is important to make the context of HRV measurements clear.1
Data acquisitionThe first step in the procedure prior to HRV analysis is to determine the R-R interval time series, which can be done using various devices. In this context, aspects related to the devices used, the data acquisition rate, software used, time of registration and simultaneous data collection of various signals should be considered.
Devices usedMost common shortcomings- 1.
Failing to mention and specify the characteristics of the instrument(s) that were used to determine the RR interval time series.
There is a wide range of systems/equipment on the market that are used to acquire electrocardiographic signals or R-Ri (and beat-to-beat heart rate). Among them, heart rate monitors of one or more channels whose ECG signals pass through an analogue digital converter and are stored for further processing and analysis; or heart rate monitors for short term recording (e.g. Polar) or monitors for long term recording, such as the 24-h holter system.4 In addition, biological signal acquisition systems coupled with an ECG amplifier are also available.1 Heart rate monitors, which are practical and low-cost devices compared to other devices, are used to collect beat-to-beat heart rate and, consequently, analyse HRV indexes.39 However, heart rate monitors have limited correlation to 24-h holter-ECG.4
ECG acquisition rateMost common shortcomings- 1.
Not mentioning the acquisition rate or sampling rate of the device used to determine the R-R interval time series.
The acquisition rate or sample rate is defined as the number of times a signal should be measured and converted at a given time interval. Therefore, the higher the sampling rate, the greater the number of signal measurements in a specific time interval, and the importance of its description.40
The ideal range for the acquisition rate is between 250 and 500Hz.4 However, there are recommendations of a minimum sampling rate of 500–1000Hz, while a sampling rate of 126Hz has been found in applications such as HRV Biofeedback.21
Software used to extract R-R intervalsMost common shortcomings- 1.
Failing to mention the software that was used to extract the R-R intervals that are associated with the measurement devices.
There are many different software applications that can convert the signal acquired by the acquisition device into the R-R interval time series. Mentioning the one that was used is fundamental to ensure the quality of the data collection.4,21
Recording lengthMost common shortcomings- 1.
Capturing very short R-R intervals that do not properly analyse HRV indices;
- 2.
In laboratory conditions, capturing very long R-R intervals that will not be used in the analysis, which makes volunteers impatient and restless;
- 3.
Failing to mention the recording length used for analysis;
- 4.
Failing to mention whether the period analysed considers the time or number of heartbeats.
The recording length of the R-R interval time series to be used for analysis may be short or long term, depending on the nature of the study, the method that will be used for HRV analysis (time domain or frequency domain),38 the availability of instruments and the objective of the study.
Long term series are obtained using Holter systems, which can determine R-Ri for 24h. Considering that the cardiac cycle variance values increase according to the recording length, using 24-h ECGs with a minimum of 18h of analysable data is suggested, i.e., the total of all R-R intervals with sinus rhythm should be ≥18h4; considering that HRV values at night are not similar to values from ECG recordings of the same length performed during the day, we suggest including both periods in the long term recording analysis.1,41 Regarding sleeping, it has also been suggested to analyse stable periods within the main 6h of sleep.30
On the other hand, R-Ri recordings using children as volunteers are more complex due to them being impatient and restless. Short term recording lengths are suggested for these subjects.
In general, a minimum time of 5min4 (or window of 256 inter-beats intervals)42 is appropriate and a recommended duration for short-term series to compute low and high frequency HRV components of spectral analysis.4,42 Moreover, special attention should be given to the ultra low frequency (ULF) and very low frequency (VLF) components that can only be correctly analysed from long term records.1,43 Thus, the evaluation of these components should be avoided for short-term recordings.1,43 The experimental design should provide recordings of a minimum amount of R-Ri that can properly analyse the HRV indices. Regarding the linear analyses that will be used for HRV, time-domain methods are suggested for long-term measurements while frequency-domain methods are recommended for short-term HRV measurements.1,4 However, in some situations, if time-domain methods are used to evaluate HRV from short-term recordings, we recommend using a recording of at least 5min.4 It should be emphasised that short periods of recording poorly estimate HRV values of 24h,32 for example, 24h standard deviation of NN interval (SDNN) values predict risks of myocardial infarction while 5min SDNN values do not predict them.21 Therefore, using these indices with different registration times requires careful interpretation.
Regardless of how it is registered, and the method used (time or number of inter-beats intervals), these aspects should be mentioned in the text. Besides that, for comparative analyses we recommend using temporal series with the same length time4 or number of R-R intervals as this ensures reliability of the data analyses.1
On the other hand, establishing normalisation of the mean HRV/HR is also another alternative suggested by some authors,44,45 when working with data in which the HR baseline is very different among the evaluated subjects or during interventions that alter the HR.1,44
Regarding the duration and quantity of R-R intervals established for non-linear analyses, the recommendations depend on the method of analysis used.2
Recording other signals simultaneouslyMost common shortcomings- 1.
Not mentioning the variables that were determined simultaneously, synchronously with the RR interval time series;
- 2.
Failing to mention the time of the data collections in which the variables were determined.
Registering physiological variables simultaneously capturing the R-R intervals of the time series is common. Breathing, sympathetic nerve activity of the peripheral nerve, arterial pulse pressure, among others, can be determined.21 Establishing these variables can influence the autonomic nervous system and change the HRV, therefore all precautions to minimise this influence should be taken4 (e.g. offering volunteers guidance on data collection procedures; always avoiding possible manipulation that causes discomfort to the volunteers,27,35 etc).
Breathing rate during data collectionMost common shortcomings- 1.
Not mentioning if the respiratory rate was observed and recorded during the data collection;
- 2.
Not mentioning the data collection and control methods regarding breathing during the collection;
- 3.
Performing manoeuvres to accentuate respiratory sinus arrhythmia in data collections that should be using spontaneous breathing.
Breathing directly influences the HRV, therefore the standard adopted during data collection (e.g., spontaneous or controlled breathing) should be referred to.
Respiratory movements can be recorded using specific devices, such as a respiratory belt attached to the chest. Obtaining the respiratory rate, simultaneously to the R-R intervals of the ECG, is used to evaluate the respiratory rate synchronisation with the high frequency (HF) component of the spectral analysis.4 It is important to note that when the respiratory rate presents values lower than 8breaths/min, i.e. below 0.15Hz, the respiratory signal decomposition will generate power spectrum values that correspond to the low frequency (LF) band of the spectral analysis. In these conditions, this component should not be interpreted.1,40
Furthermore, some controlled conditions in the laboratory such as mental arithmetic tests or conversation during the experiment approximate the respiratory rate to the LF band.46
Another source of error for HRV analysis that should be observed is the volunteer's performance concerning the accentuation of respiratory sinus arrhythmia (RSA) during data collection that should be using only spontaneous breathing. RSA is a cardiorespiratory phenomenon characterised in humans by heart rate fluctuation associated with inspiration and expiration.47 During the respiratory cycle, there is an increase in the heart rate during inspiration, followed by a decrease during expiration,26 which promotes an oscillation of heart rate or R-R intervals and increases HRV.
The manoeuvre to accentuate RSA is used as an autonomic test because there is a relationship between respiratory movements and the heart rate fluctuation.26,48 One of the mechanisms that explains this relationship is the change in lung volume during the manoeuvre which contributes to changes in venous return; the periodic oscillation of the venous return acts directly by stretching the wall of the right atrium and the sinus node. Furthermore, these blood volume oscillations in the pulmonary vascular bed help fill the left ventricle, which results in changes in the arterial pressure and baroreflex activation mechanisms.48,49
When the manoeuvre is performed in a respiratory rate around 6 cycles/min there seems to be a superposition of the biphasic heart rate responses, predominating the heart rate increase response during inspiration and a reduction during expiration.48
Another aspect that should be observed refers to the HRV analysis during physical exercise as the increase in the respiratory rate shifts the high frequency (HF) band of the spectral analysis to the right, changing the bands in which they are to be analysed.50 Another condition is the HRV spectral analysis of patients resting in the recent postoperative period (e.g., 1st and 2nd postoperative days of myocardial revascularisation surgery) because the presence of a high respiratory rate is very frequent in this condition7,17 and this may also contribute to shifting the HF band. In this case, the processing software should allow the upper limit of the high frequency band to be extended, e.g. from 0.4 to 0.5Hz.
The HRV respiratory component depends on the volume and respiratory rate. Thus, considering that the high frequency (HF) component decreases sharply when the respiratory volume decreases and the peak respiratory power increases when the respiratory rate decreases,40 some researchers set the respiratory volume and use a metronome to help control breathing. However, using this device to control a constant respiratory rate can produce emotional interference and thus induce stress, which will influence the HRV autonomic modulation by increasing the sympathetic modulation. It is recommended that respiratory rates are used close to the subject's natural respiratory rate40 to minimise the stress caused by utilising this device. In general, during controlled breathing, the respiratory rate should be ensured above the LF band of the spectral analysis.1
Data processingRegarding processing the R-R interval time series for HRV analysis, aspects related to signal quality, choosing the excerpt to be used and the presence of ectopic beats, arrhythmias and noise should be considered.
Signal qualityMost common shortcomings- 1.
Failing to mention and characterise the quality of the collected signal;
- 2.
Failing to discard a bad signal;
- 3.
Not redoing the data collection when needed.
Special attention should be paid to the quality of the normal R-Ri series (intervals between cardiac depolarisations of normal sinus rhythm) used in the HRV analysis. Thus, the R-Ri time series should be sufficient for analysis, they should be preferably stationary and also of good quality, i.e. not having arrhythmias, ectopic beats and artefacts or noises that could affect the analysis.38
The stationarity or stability of the R-Ri recordings is essential for HRV measurements in the frequency domain. It should be mentioned that only in this condition does the power of a certain spectral component represent the true modulation of the HRV at that frequency. It is important to avoid situations where there is no rest period prior to a collection, and thus the physiological variables do not stabilise before the beginning of the recording.38 A rest of at least 15min is recommended prior to collection in the body position that will be used in the HRV study.1,4,38 In order to use a protocol/intervention that produces a stimulus such as a tilting, passive postural manoeuvre, an active postural manoeuvre or a constant load physical exercise protocol, after applying these stimuli, the HRV spectral analysis should not be performed in the early phase of the response to the stimulus, but after the moment when there is stability of the studied signals.25,30,38 In situations where the immediate acute effect is what needs to be measured, choosing other forms of analysis, such as heart rate delta (time domain analysis) or wavelet analysis51 is necessary.
In order to check the stability/stationarity of the signals, traditional statistical tests, i.e., those comparing the distribution of the R-Ri can be used.4 One way to evaluate the stationarity of these heartbeats for the analysis could be by the percentage of the mean and standard deviation differences between each pair of segments of the time series established for the analysis.4 Another way is recommended by Magagnin et al.52
On the other hand, if non-stationary signals are identified, it has been recommended that the trend can be removed from the beat-to-beat data, using filters or specific algorithms. However, inappropriate trend removals can affect spectrum components and result in the dominance of low frequency variability and this may make it difficult to interpret the analyses performed.4,38 In the presence of non-stationary series, with detrended (progressive increases or decreases or sudden alterations of the R-Ri variance), the series should preferably be excluded or the non-stationary sequences should be disregarded,38 reporting these conducts when describing the method.
Choosing the excerptsMost common shortcomings- 1.
Not presenting the number of beats or the duration of time selected for analysis;
- 2.
The length of the sequence selected for the analysis is not constant for all the volunteers that make up the study;
- 3.
The selected sequence is not stationary (or presents detrended), especially if the analysis to be used is in the frequency domain (spectral analysis).
The R-Ri time series processing for HRV analysis requires some care regarding the sequence selected for the analysis. The selected segment must be of good quality, i.e. no artefacts or noises that could affect the analysis and the R-Ri number or length of time of the sequence selected for analysis should be presented/reported.
In general, as indicated by several studies using non-parametric spectral analysis of HRV (by Fast Fourier Transform), it is recommended to use at least 512 points for a minimum time of 5-min recordings.4 However, studies using parametric spectral analysis (autorregressive algorithms) show that even with more short segments of data (for example, window of 20053 or 256 inter-beats intervals42), a reliable and accurate spectral estimation53 of the low and high frequency HRV components can be provided.4,42,53
On the other hand, a recent study54 evaluated if excerpt selection methods and techniques used to identify and edit artefacts in short-term RRi recordings interfere in HRV analysis. The authors showed that the selection methods interfere in the non-linear HRV analysis and suggested choosing 256 points of greater stability of the R-R intervals. While for edition of excerpts, they suggest using the confidence interval or replacing them by the average of previous data that seem to be the most appropriate procedures to treat the data previously the analysis.
Moreover, it is recommended that the length of the excerpt selected for analysis should be equal for all the volunteers that make up the study.4,42 It is inappropriate to compare HRV measurements obtained from recordings with different lengths of time.4 Concerning long-term recordings, which includes the presence of specific periods such as being awake, sleeping, resting, various activities, etc., the physiological mechanisms of the cardiac period modulation responsible for the LF and HF components of the spectral analysis cannot be considered stationary if the analysis performed entails the whole 24-h period.1,4
Presence of ectopic beat, arrhythmias and noiseMost common shortcomings- 1.
Not considering the presence of noises, ectopic beats and arrhythmias;
- 2.
Using an excerpt with noises, ectopic beats and arrhythmias.
The HRV analysis is based on evaluating sinus rhythm variability. Thus, ectopic beats, missing data, arrhythmic events and noise may alter the power spectral density estimation by introducing an error into the HRV spectral analysis.53,55 Thus, in ECG signal registers, visual inspection and manual editing are mandatory to verify the presence or absence of arrhythmias and to correctly identify QRS complexes of the ECG.38 Automatic digital filtering can be used to help identify ectopic beats and/or noises, however, it should not replace manual editing, but rather complement it.38
Therefore, ectopic beats, arrhythmias and noise should be removed from the R-Ri series of ECG and subjected to interpolation using different methods, such as linear interpolation, where the R-Ri ending or beginning with an ectopic beat may be replaced by more adjacent R-R intervals defined by normal R waves4; or based on splines that are 2nd or 3rd order polynomials.40 If the order is 2, then the spline is a parabola and the parabolic interpolation can be performed as described in.56
Parabolic interpolation cannot be used with R-Ri recordings from heart rate monitors (such as Polar) because with specific software of this monitor only the durations between consecutive beats are recorded and plotted as a function of time. However, this software uses a specific filtering process. Authors have used a Polar standard filter in the moderate condition, in which a minimum protection zone of 6 beats is considered.57
In addition, considering that the recording should not have any artefacts, noise, premature ectopic beats or spikes that might affect the analysis if they are not removed, visual inspection and manual editing are recommended.4 When manually editing the data and in the interpolation, the preceding/successive R-Ri (or beats) should be considered in relation to the edited R-Ri (or beat).4 Furthermore, the number of R-Ri (or beats) that were omitted and interpolated should also be described.
In general, it is recommended that only time series with qualified R-R intervals (without premature ectopic beats, no missing data and no artefacts) should be included in the analyses.4,20
Data analysisHRV analysis methods can be divided into linear methods and non-linear methods.
Data analysis using linear methodsMost common shortcomings- 1.
Not properly defining the HRV indices used for analysis;
- 2.
Not mentioning the frequency bands used in HRV analysis in the frequency domain;
- 3.
Failing to mention the method used to calculate the indices in the frequency domain;
- 4.
Not mentioning the window used during the analysis in the frequency domain using the Fourier transform or the range of variation of the order of the model adopted when using the autoregressive model;
- 5.
Not mentioning what adjustments were used in the software for calculating the HRV indices.
- 6.
Failing to describe the software used to calculate the indices.
The HRV can be evaluated using linear methods, analysed in the time and frequency domains, and non-linear methods.1,3 Time domain methods are thus termed by expressing the results in unit time (millisecond).
In the time domain, statistical and geometric indices are obtained using mathematically simple techniques that measure the variability present in the R-Ri time series (e.g. average R-R intervals, standard deviation variations of R-R intervals or median heart rate, interquartile interval, 95% confidence interval and histogram-derived indices or cartesian coordinate mapping of R-R intervals) and provide indexes that interpret fluctuations throughout the cardiac cycles.4
Among the statistical indices, the SDNN, SDANN, RMSSD and pNN50 can be cited, whereas the triangular index, TINN and the indices derived from the Poincaré plot represent the indices obtained using geometric methods.3,4 The Poincaré plot is considered by some authors as a method based on nonlinear dynamics.2,11 This will be addressed further in “Data analysis using non-linear methods” section.
In the frequency domain, the spectral analysis is used, which allows the decomposition of the variation of a R-Ri time series in their fundamental oscillatory components, i.e., the frequency bands,3,4 emphasising high frequency (HF) fluctuations ranging from 0.15 to 0.4Hz and representing vagal modulation4,58; low frequency fluctuations, ranging from 0.04 to 0.15Hz and representing sympathetic and vagal modulation, with sympathetic predominance. This frequency range is also modulated by the baroreflex and cyclic blood pressure oscillations4,59; and very low frequency (VLF) fluctuations, with a variance range between 0.003 and 0.04Hz and an ultra low frequency (ULF), with a variance range between 0 and 0.003Hz. These frequency ranges are considered to be from much slower oscillations and appear to be influenced by factors linked to thermoregulation controls and peripheral vasomotor tonus,1,4 as well as the neuro-hormonal control linked to the renin–angiotensin–aldosterone system.60 However, they also seem to be related to humoral factors, such as nitric oxide, atrial natriuretic peptide, catecholamines.1,4 As described above, adjustments in the values of these bands may be necessary depending on the experimental condition used.
In order to obtain indexes in the frequency domain, the R-Ri tachogram or heart rate is processed by mathematical algorithms, such as Fourier transform or autoregressive models.40,53 Fourier Transform is used during stationary or stability phases of the signals and enables tachogram signals to be recovered even after transformation, which shows how objective it is as information is not lost during the process.58 In an autoregressive model, the power contained in the peaks can be calculated without needing the pre-defined spectral bands.40,53
In general, prior to the Fourier transform spectral analysis, the time series will be screened in segments with 256 R-Ri or multiple intervals (e.g. Hanning window), with a 50% overlap, i.e. the Welch Protocol.4,40 In the autoregressive method, the original time series will be described by an autoregressive model whose model order is usually defined by the Akaike Information Criterion.61
After determining the model order, the power spectral density is calculated. Depending on the model order used, spectrum smoothing may take place. Thus, the smaller the autoregressive model order, the smoother the autoregressive spectrum is. On the contrary, the higher the model order, the more details can be seen, i.e., the less smooth the autoregressive spectrum will be. In general, it has been described that the normal range for the model order is between 08 and 20.38
In order to analyse the HRV indices using linear and non-linear methods, various software packages can be used. Regardless of the type, it is recommended that the software used should always be described.1
Data analysis using non-linear methodsMost common shortcomings- 1.
Not mentioning whether the R-R interval time series is normal (N-N intervals);
- 2.
Affirming that non-linear methods replace the use of linear methods in HRV analysis;
- 3.
Evaluating short periods of HRV with geometric methods;
- 4.
Failing to describe the software used to calculate the indices.
HRV can also be evaluated based on non-linear dynamic methods as nonlinear phenomena are certainly involved in the genesis of HRV.2 It has been proposed that this type of analysis can identify complex interactions from various mechanisms that are markers of cardiac variability,1 thus providing valuable information that can characterise the complexity, irregularity, and predictability of system properties,3,62 and consequently help assess the risk of sudden death.2,9,19 This form of analysis complements the conventional HRV measurements.
EntropyEntropy is an approach used to quantify the regularity (complexity) of the R-Ri series fluctuations, the content of data information63 or the organisation of heartbeats, i.e., as the R-Ri sequences of a time series are repeated over time.64
There are several ways to determine the entropy of a time series, and in general they require recordings whose data has no noise. In relation to the R-Ri recording length, there are methods that require very long recordings, for example Multiscale Entropy, where the number of points (R-Ri) must be greater than 10,000,65 which limits its use in many clinical studies. Thus, some entropy measurements of relatively short recordings were developed, such as Approximate Entropy, N>800 points and m=266; or short recordings, such as Sample Entropy, N<200 points67 and Shannon and Conditional entropies, N≤300 points.1,2,64 Higher values of these indices indicate high irregularity (greater complexity, less predictability) and lower values indicate a more regular signal (more predictable and less complex).
Poincaré plot indexesTo represent the HRV data, the Poincaré Plot was used. Also known as a return map or Lorenz plot, the plot represents an R-R interval time series in a cartesian plane in which each R-R interval is correlated with the posterior interval and defines a point on the plot.4 Thus, each point is represented on the horizontal axis (X-axis) by the preceding normal R-Ri, and on the vertical axis (Y axis) by the following R-Ri.62 It can be analysed qualitatively (visual), which shows the degree of complexity of the R-R intervals and is evaluated by the figure formed by its attractor,68 or quantitatively, by adjusting the ellipse of the formed figure by the attractor that provides SD1, SD2 indices and SD1/SD2 ratios.68
SD1 represents the dispersion of points perpendicular to the identity line and appears to be an index of an instantaneous recording of beat-to-beat variability. This index is characterised as a marker of cardiac parasympathetic modulation; SD2 represents the dispersion of points along the identity line and indicates the HRV in long-term recordings. It jointly characterises the cardiac sympathetic and parasympathetic modulation; the relationship of both (SD1/SD2) shows the ratio between the short and long variations of the R-R intervals.69 In the qualitative analysis of the Poincaré plot, the figures formed by the attractor were described by Tulppo et al.,70 who classified them as: (1) a comet-like figure, in which an increase in the dispersion of the beat-to-beat R-R intervals is observed with an increase in the R-R intervals, characteristic of a normal plot; (2) a torpedo-like figure with small global beat-to-beat dispersion (SD1) and increasing the dispersion of R-R intervals in the long term; (3) a complex or parabolic figure, in which two or more distinct ends are separated from the main body of the plot, with at least three points included at each end.
Considering that geometric methods are unsuitable to evaluate short-term HRV changes, a recording time of at least 20min, but preferably 24h, is recommended to evaluate the correct performance of these methods.4
Detrended fluctuation analysisDetrended fluctuation analysis (DFA) is a method that characterises internal correlations of a signal because it quantifies the presence or absence of fractal correlation property in R-R interval time series.2 These correlations are expressed by scalar properties and fractal structures by specific indexes, DFAα1 and DFAα2. The values of these indices can be: mean value (0.5) corresponds to randomness; value one (1) indicates chaotic behaviour; value one and a half (1.5) corresponds to regularity.71 These indexes are used to evaluate cardiovascular diseases and their risk factors.2,19,71
Correlation dimensionCorrelation dimension is one of the simplest methods to estimate the dynamics of a system by the size of its attractor, i.e. the path through which the system converges.72 It is a measure of system complexity, defined as the slope of the regression line calculated from a log-log representation. Higher values reflect higher adaptive responses to internal or external stimuli in an environment of constant changes, therefore when correlation dimension increases, the system becomes more complex.40
Symbolic analysisThe basic idea of this method is to transform an R-R interval time series into a sequence of integers (symbols), which maintains the dynamic characteristics of the original time series.73 Considering short time series, it was described by Porta et al.64 in 2001. This technique is based on transforming an R-Ri time series into a sequence of integers (symbols). Thus, the R-Ri series will be quantised and distributed into levels, ranging from 0 to 5, by constructing patterns of three sequential symbols which are then grouped into families, 0V (patterns without variations), 1V (patterns with one variation), 2LV (patterns with two similar variations), 2UV (patterns with two different variations). Afterwards, 0V%, 1V%, 2LV%, 2UV% will be evaluated in rates of occurrence. It should be noted that the distribution of patterns can be interpreted in terms of entropy, and a simple measurement is the Shannon entropy.64,73 Regarding the significance of these symbols, a previous study carried out in humans using pharmacological blockades12 indicated that the 0V% and 2UV% indexes are representative of autonomic sympathetic and parasympathetic cardiac modulations, respectively. The index of 1V% represents sympathetic and parasympathetic modulation, while 2LV% represents parasympathetic modulation. This was also validated during passive-tilting postural manoeuvre.56 This analysis was used in various studies with different samples: young and old healthy individuals,74 patients with type 2 diabetes mellitus,75 patients with multibacillar leprosy,76 patients with fibromyalgia,77 patients with coronary artery disease10,12 and patients with dilated cardiomyopathy,11 among others.
ConclusionThis article includes recommendations and a checklist regarding the use of HRV collection and analysis methodology aiming to improve the reporting of evaluation and intervention results using HRV. And consequently to improve the specific knowledge of this methodology which has proved to be useful as a complementary tool for clinical evaluation and assess the effect of non-pharmacological therapeutic interventions, such as physical exercise programmes, on cardiac autonomic modulation.
Conflicts of interestThe authors declare no conflicts of interest.
This study was supported by the Conselho Nacional de Desenvolvimento Científico e Tecnológico-CNPq (research scholarship grant number #3121938/2013-2 to AMC). CNPq had no role in the decision to publish or the preparation of the manuscript.


